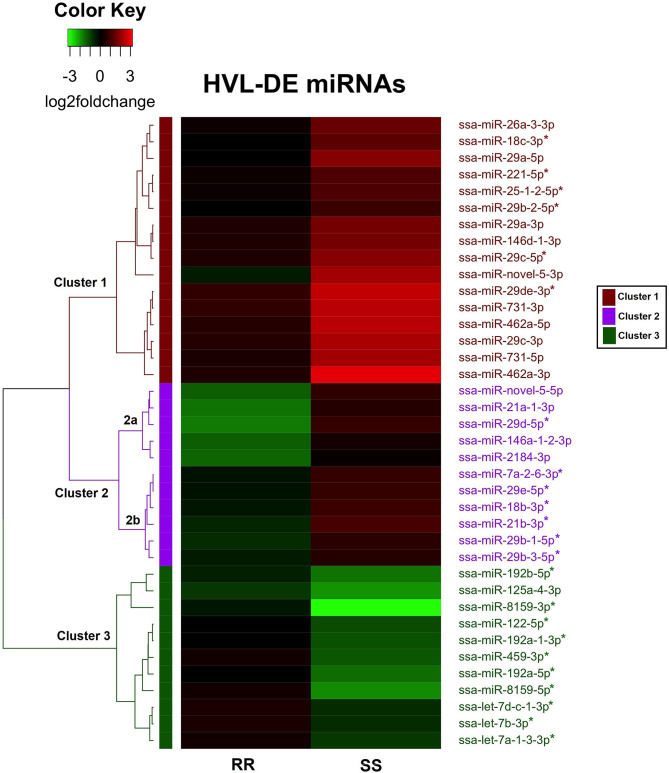
Figure 5.
Heat map and hierarchical clustering of the 38 HVL-DE miRNAs. Each row represents a miRNA, and the columns represents the expression changes (log2foldchanges) in RR and SS groups at 20 dpc compared to controls. The dendrogram on the left shows the three major clusters of the HVL-DE miRNAs. The direction of the miRNA expression changes (log2foldchanges) are illustrated on the color key. Black color represents the expression in controls (baseline expression), red color indicates increased expression and green color indicates decreased expression. The color bars on the right indicate the three major clusters in which the HVL-DE miRNAs with similar expression profiles were grouped.

