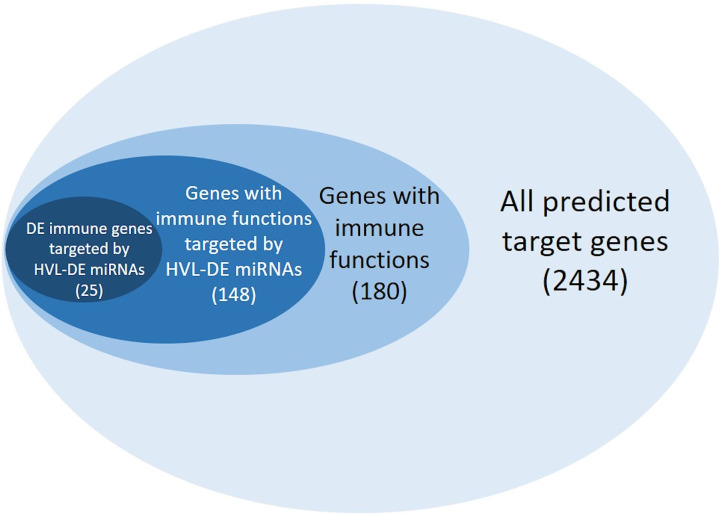
Figure 6.
Number of miRNA targets identified by our stepwise approach (n = 2,434). The targets with GO terms associated with immune functions are shown in light blue (n = 180), while the immune genes showing different expression in comparison of the RR groups and SS groups (n = 148) are shown in blue, and finally the immune genes differently expressed at 20 dpc (microarray analysis) and predicted as target for HVL-DE miRNAs are shown in dark blue (n = 25).

