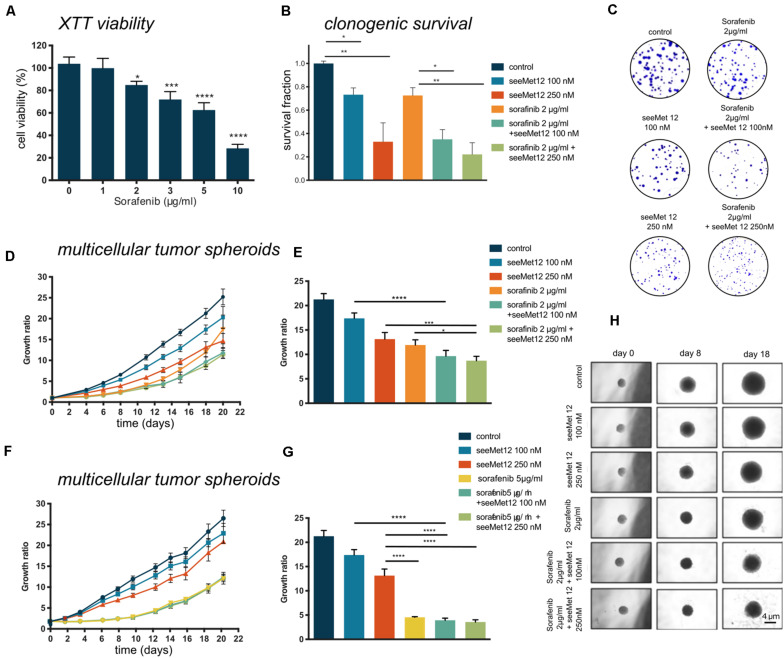
FIGURE 3.
Characterization of seeMet 12 therapy in combination with sorafenib treatment. (A) Cell viability (XTT assay) of HT-29 cells after exposure of 1–10 μg/ml sorafenib. N > 3, Error bars represent SD. (B) Clonogenic survival assay of HT-29 cells treated with seeMet 12, sorafenib, or the combination of the two. Cells were exposed to 100 or 250 nM seeMet 12 and 2 μg/ml sorafenib, N = 4, error bars represent SD. (C) Representative images of the colonies in the clonogenic survival assay after 14 days. (D) Multicellular HT-29 tumor spheroid assay treated with 100 or 250 nM seeMet 12 and/or 2 μg/ml sorafenib. n = 10 for control, n = 5 for treatment groups. Error bars represent SD. (E) Comparison of the spheroid sizes in panel (D) on day, 18 Error bars represent SD. (F) Multicellular HT-29 tumor spheroid assay with 100 or 250 nM seeMet 12 and/or 5 μg/ml sorafenib. n = 10 for control, n = 5 for treatment groups. Error bars represent SD. (G) Comparison of the spheroid sizes in panel (F) on day 18. Error bars represent SD. (H) Representative images of the spheroids after the different treatments. Size reference bar = 4 μm. Considered to be statistically significant *p < 0.05, **p < 0.01, ***p < 0.001, ****p < 0.0001.

