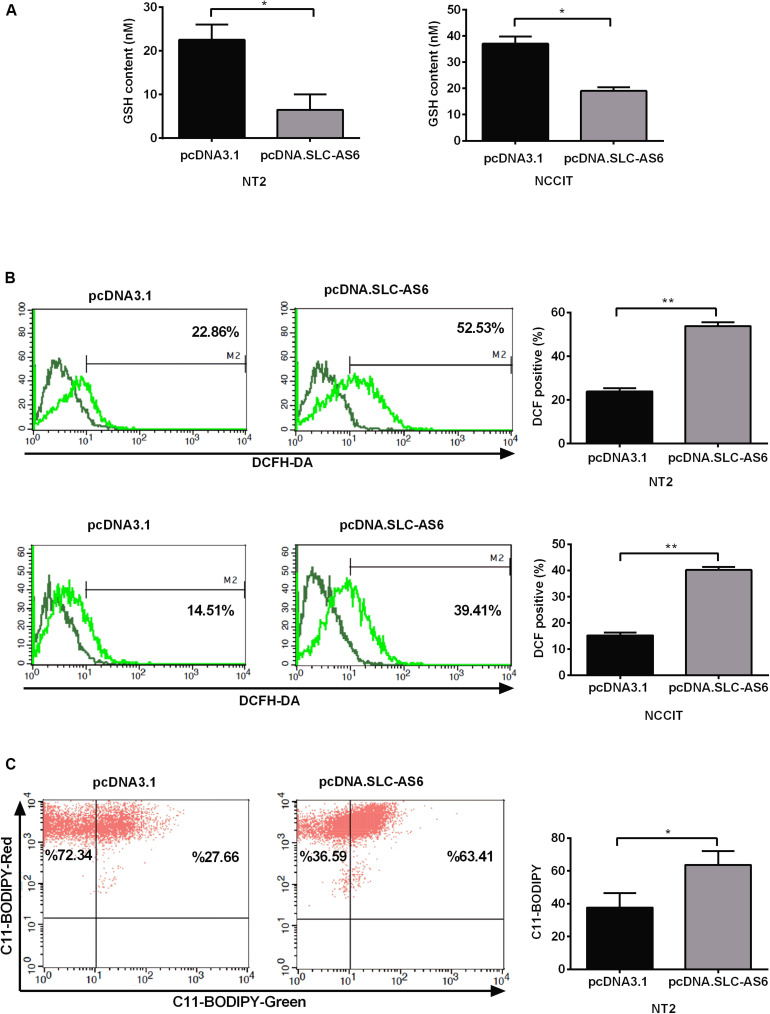
FIGURE 7.
Assessment of oxidative stress markers after overexpression of SLC-AS6. (A) Transfecting SLC-AS6 diminished the glutathione (GSH) levels significantly relative to mock-transfected cells in NT2 and NCCIT cell lines. (B) Cytosolic reactive oxygen species (ROS) levels were elevated significantly after overexpression of SLC-AS6 in NT2 and NCCIT cells. (C) Transfecting SLC-AS6 in NT2 cell line leads to an increase in lipid peroxidation detected by C11-BODIPY staining. Error bars show standard error of mean (SEM) of triplicated experiments (*P < 0.05 and **P < 0.01 using independent sample t-test).

