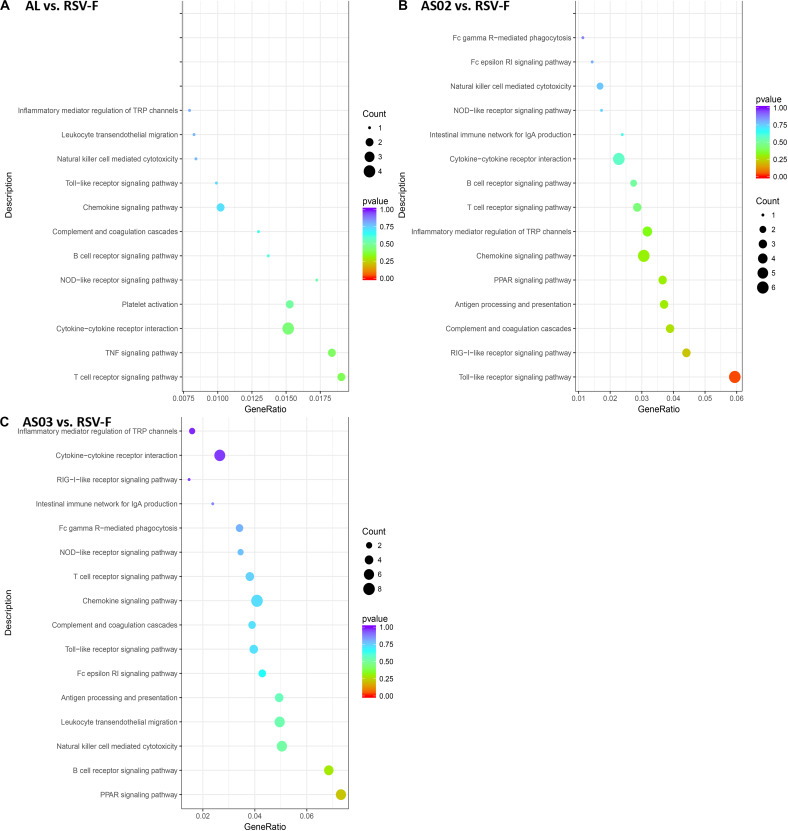
FIGURE 10.
DEG KEGG pathway enrichment after vaccination. DEGs (A) Al vs. RSV-F, (B) AS02 vs. RSV-F, and (C) AS03 vs. RSV-F were used for KEGG pathway analysis using the DAVID functional enrichment database. The x-axis is GeneRatio (The ratio of KEGG pathway-annotated genes to the total DEG number). The y-axis shows the KEGG pathway. Point size represents the number of DEGs associated with each term. Color reflects the enriched pathway significance level.

