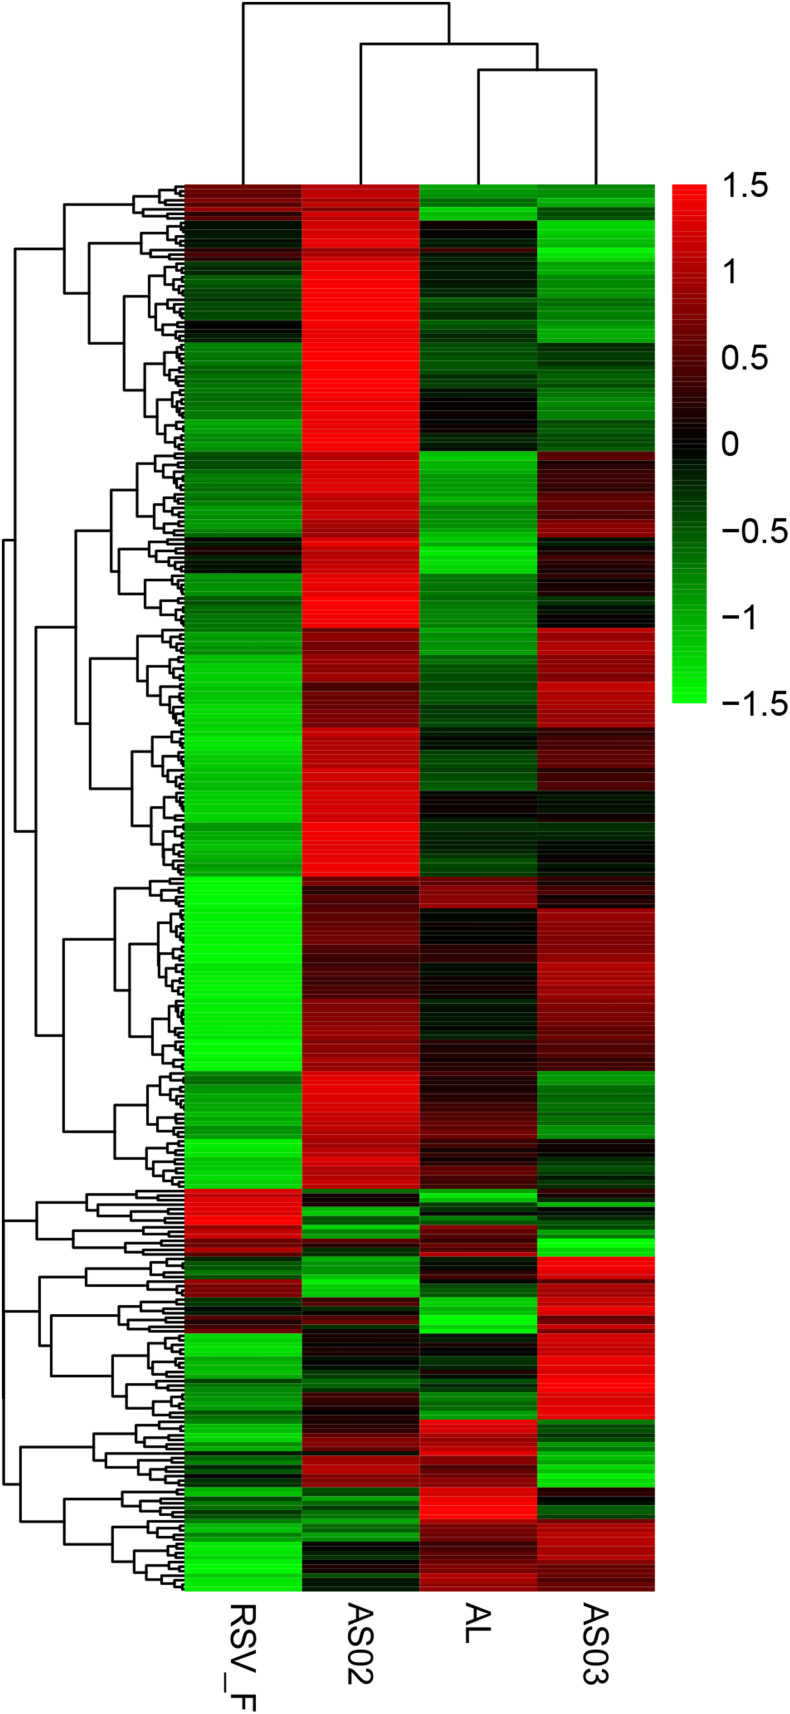
FIGURE 7.
Hierarchically clustered heat maps showing differentially expressed immune-related genes between the adjuvant and adjuvant-free groups. Rows correspond to different genes and columns represent the different samples. The tree above the heat map shows the hierarchical clustering of the samples. The color scale shown in the map illustrate the log10 FPKM. Red and green colors represent high and low expression, respectively. For the description of the genes differentially expressed, please refer to Supplementary Table S1 (Hierarchically clustered heat maps) and Supplementary Table S2 (Immune-related Hierarchically clustered heat maps).

