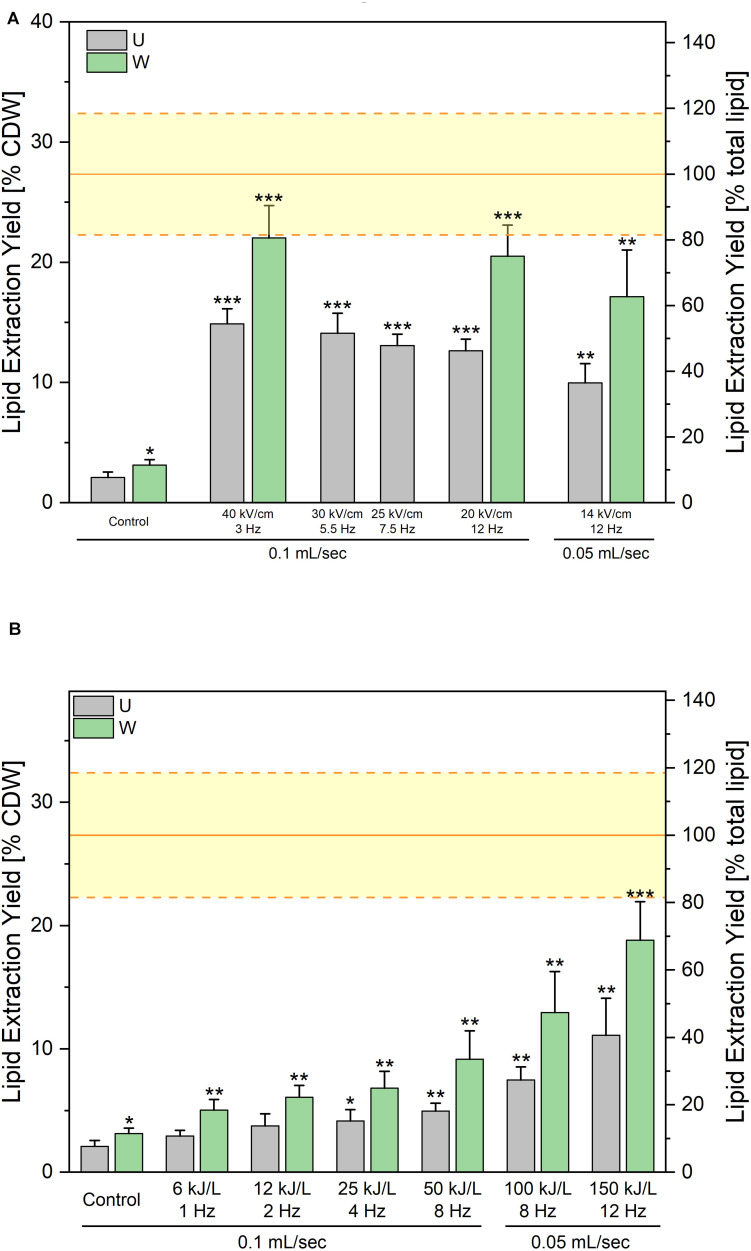
FIGURE 5.
Lipid extraction yields obtained after processing along the “unwashed-route”. PEF-treatment was applied directly after harvesting. Pulse duration was kept constant at Δt = 1 μs. (A) Impact of the electric field value at a constant specific treatment energy of 150 kJ/L. The x-axis indicates for each condition the applied electric field in kV/cm (upper values), the repetition rate in Hz at which pulses were applied (middle values) and the working flow rate of the suspension in the treatment chambers (lower values). (B) Impact of the specific treatment energy at a constant electric field value of 14 kV/cm. The applied specific energies, the repetition rate in Hz at which pulses were applied as well as the working flow rates have been indicated on the x-axis. For both graphics, the gray bars are the results of lipid extraction performed directly after the PEF-treatment (U) and the green bars are the lipid extraction yields obtained when a washing step is added after PEF-treatment before addition of extraction solvents (W). The yellow lines indicate the average ± standard deviation of Soxhlet extractions, as absolute control. Results are reported as the average + standard deviation of three independent experiments (n = 3) with samples processed in duplicates. Statistical significances are indicated in comparison with the unwashed control.

