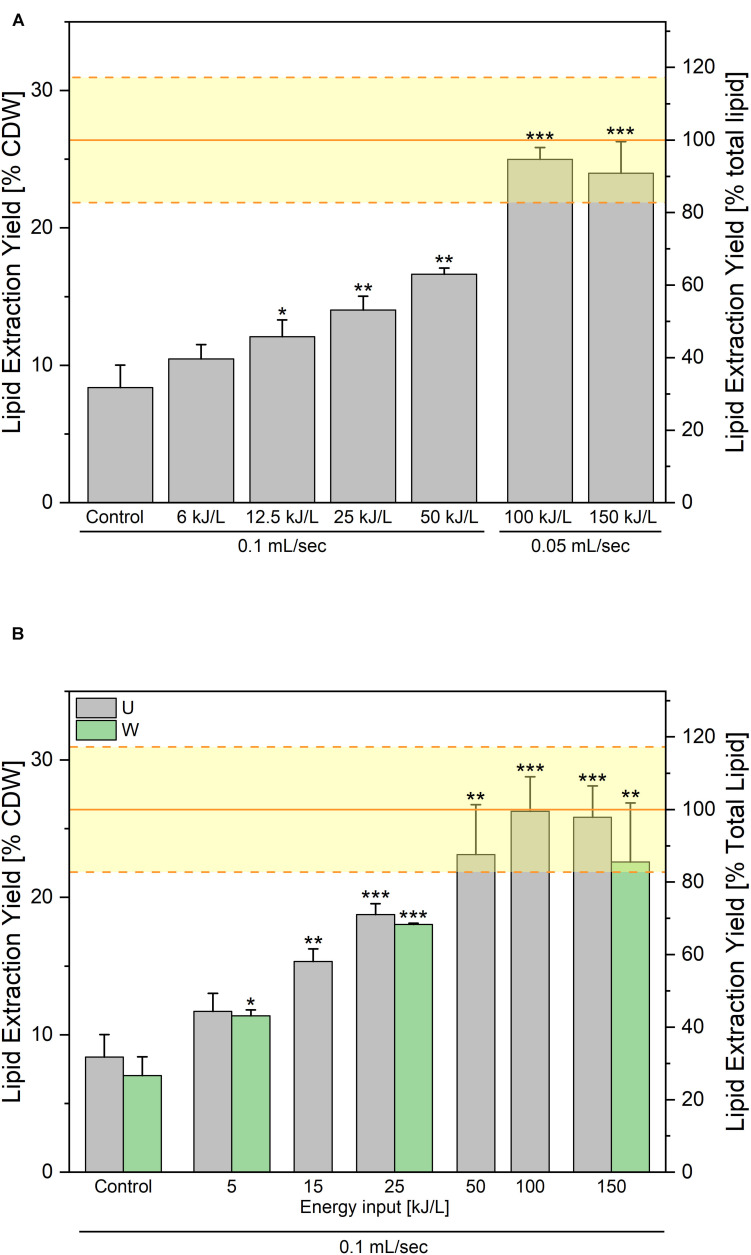
FIGURE 7.
Lipid extraction yields obtained after processing along the “washed-route.” PEF-treatment was applied on the yeast washed after harvesting. Impact of the specific treatment energy at a constant electric field value of (A) 14 kV/cm and (B) 40 kV/cm. For the bottom graph, the gray bars are the results of lipid extraction performed directly after the PEF-treatment and the green bars are the lipid extraction yields obtained when a washing step is added after PEF-treatment before addition of extraction solvents. The yellow lines illustrate the average ± standard deviation of Soxhlet extractions, as absolute control. For both experiments, the results are reported as the average + standard deviation of three independent experiments (n = 3) with samples processed in duplicates. Statistical significances are indicated in comparison with the unwashed control.

