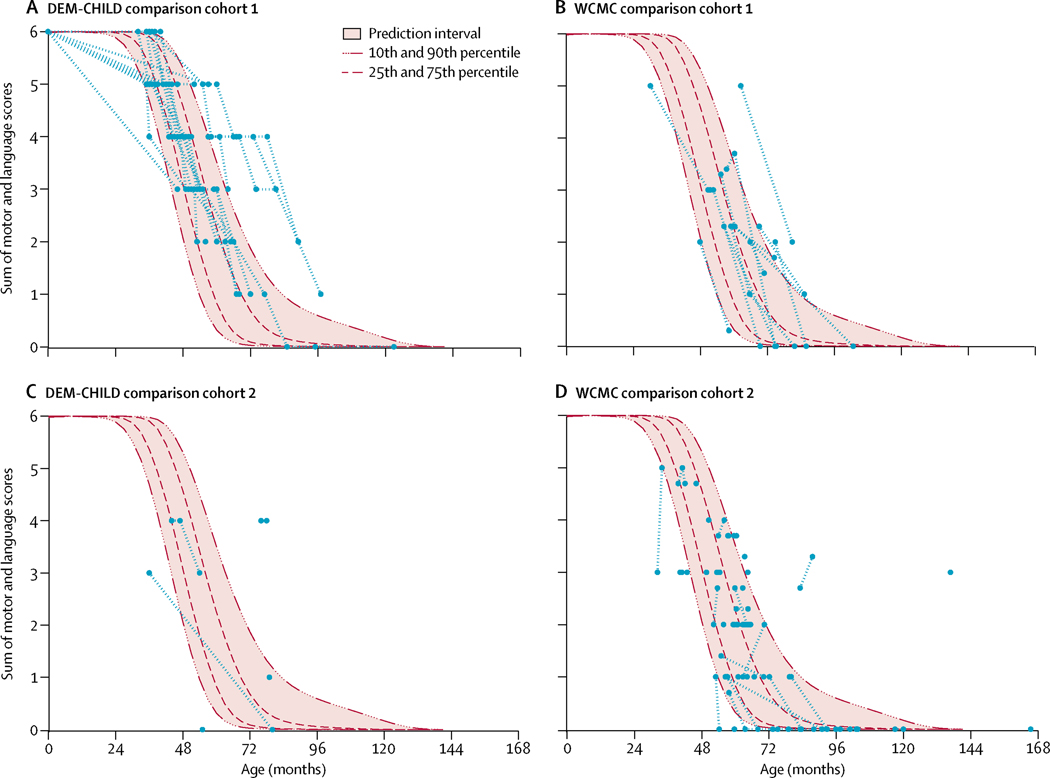
Figure 5: Motor–language scores of comparison cohorts superimposed on DEM-CHILD core data.
Motor-language score data for DEM-CHILD comparison cohort 1 (A), WCMC comparison cohort 1 (B), DEM-CHILD comparison cohort 2 (C), and WCMC comparison cohort 2 (D). Each assessment is shown as single blue point. Longitudinal assessments for each patient are linked by dashed red lines. Mean scores and 95% CIs, and 10th, 25th, 75th, and 90th percentiles for the DEM-CHILD core data are shown for comparison.

