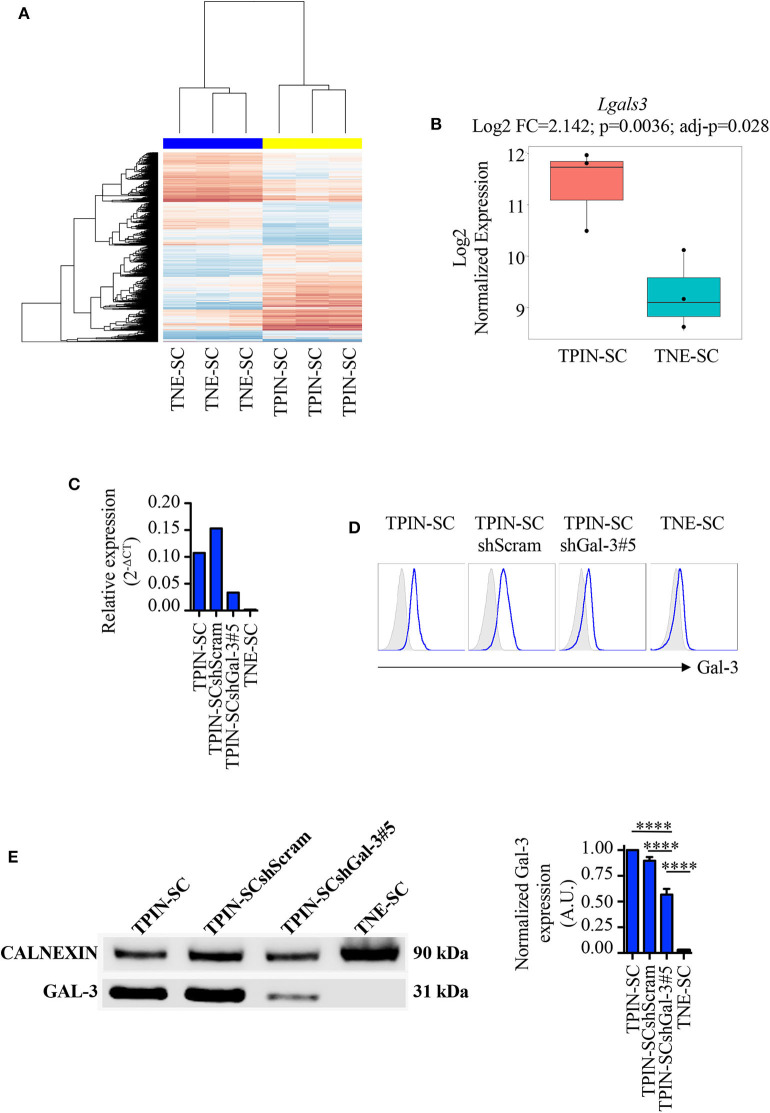
Figure 1.
Gal-3 is overexpressed in TPIN-SCs, and can be silenced by shRNA technology. Gene expression analysis of CSCs with Affimetrix Mouse Gene 1.0 ST Array. (A) Heatmap reports the global gene expression data in TPIN-SCs vs. TNE-SCs. Differentially expressed genes with a p < 0.05 are red (upregulated) or blue-colored (downregulated). (B) Boxplot reports Lgals3 expression in TPIN-SCs vs. TNE-SCs (Log2 FC = 2.142, p = 0.0036, adj-p = 0.028). Gal-3 silencing in TPIN-SCs was attempted with five different shRNA sequences. We obtained substantial inhibition of Gal-3 expression in all TPIN-SCs infected with viruses encoding Gal-3 specific shRNA (not shown). We selected TPIN-SCshGal-3#5 for our experiments. Expression of Gal-3 in the indicated cells was assessed by real-time PCR (C), flow cytometry (D) and Western blot (E) analysis. (C) Relative expression of Gal-3 in the indicated cells was assessed by real-time PCR. (D) Fresh samples for cell surface detection of Gal-3 were stained with anti-Gal-3 antibody and 7AAD. The plots report representative histograms of Gal-3 staining (blue lines), gray histograms: isotype control. TNE-SCs were used as negative control for Gal-3 expression. The panel is representative of at least three independent experiments. (E) Western blotting analysis of total Gal-3 expression in the indicated cell lines and relative quantification. The Western blot is representative of two independent experiments, performed each time on biological duplicates. The graph is a pool of four independent blots. Statistical analysis was performed using the Anova Test. ****p < 0.0001.

