Figure 3.
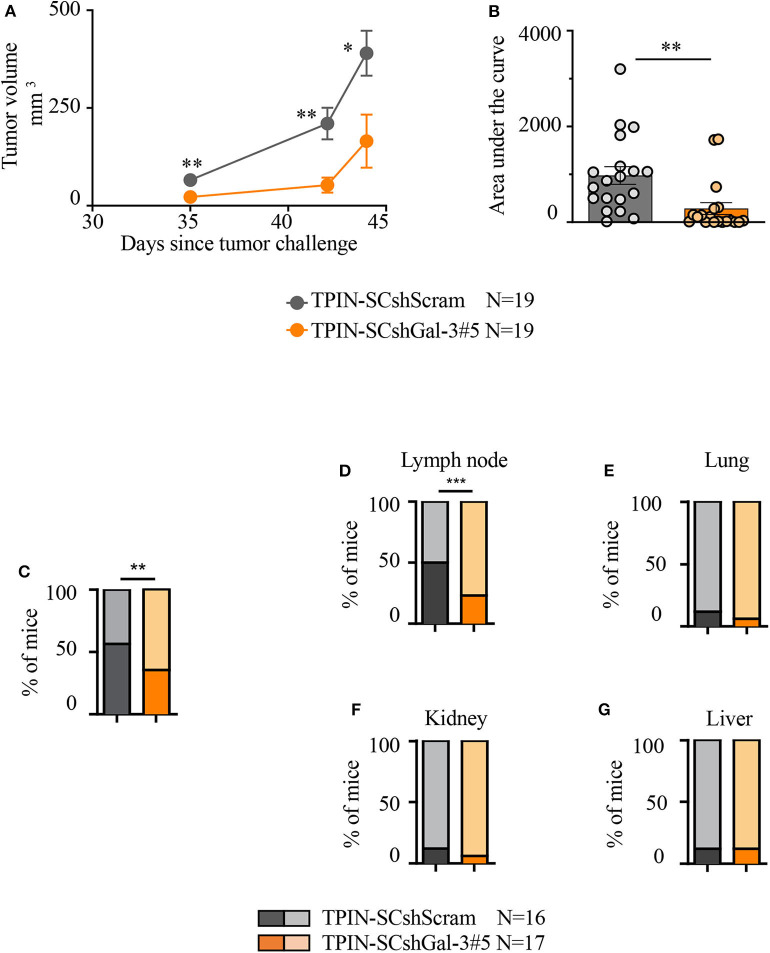
Gal-3 impacts TPIN-SC tumorigenicity and metastatic potential. (A) Immunodeficient NSG mice received 2 × 10⁶ TPIN-SCshScram or TPIN-SCshGal-3#5 (19 mice/group). The graph reports tumor growth (mm3) progression volume. Average ± SEM of tumor volume. (B) The graph reports tumor progression expressed as area under the curve at day 44. Data are reported as a percentage ± SEM. Statistical analysis was performed using the Student T-test. Data represent a pool of four independent experiments. (C) When tumor area achieved ≥80 mm2, the primary tumors were surgically resected to monitor metastatic spreading. The graph reports TPIN-SCshScram or TPIN-SCshGal-3#5 metastatic ability. (D–G) The graphs report the percentage of lymph node (D), lung (E), kidney (F), liver (G), metastatic spreading. Dark colors indicate metastasis-bearing mice, whereas light colors indicate metastasis-free mice. TPIN-SCshScram: n = 16 mice; TPIN-SCshGal-3#5: n = 17 mice. Statistical analysis was performed using the Fisher Exact Test. *p < 0.05; **p < 0.01; ***p < 0.001.

