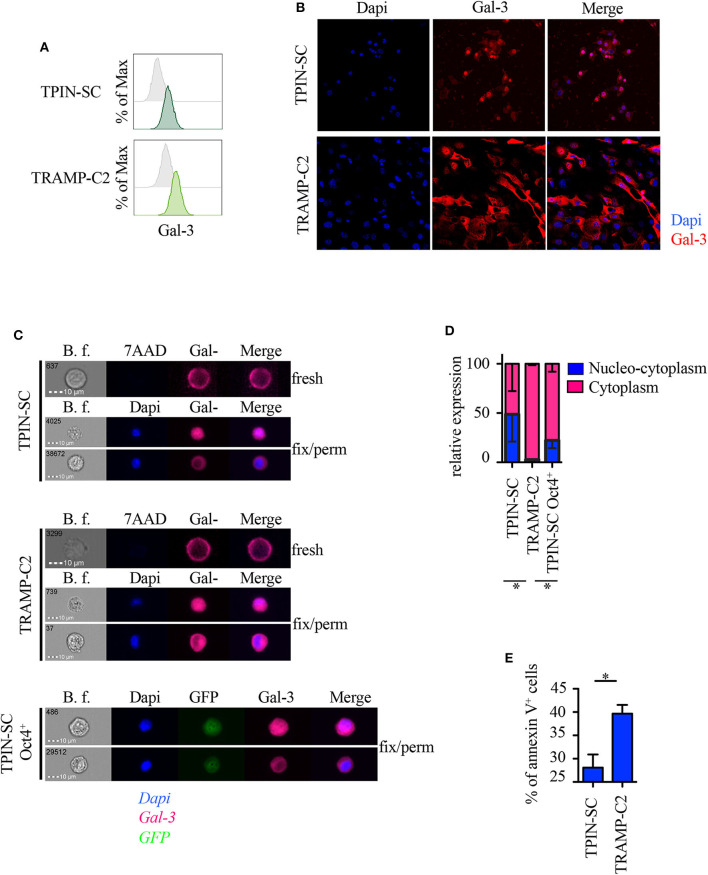
Figure 4.
Gal-3 is differently distributed in prostate CSCs and in more differentiated cancer cells. Expression of Gal-3 in the indicated mouse cells was assessed by flow cytometry analysis (A), immunofluorescence (B) and ImageStream technology (C). Fresh samples for cell surface detection of Gal-3 (A,C) were stained with 7AAD, while fixed and permeabilized samples for intracellular detection of Gal-3 were stained with Dapi (B,C). In fresh samples for cell surface detection of Gal-3, dead cells were excluded by 7AAD positivity. Since we analyzed live cells only (thus, 7AAD negative), (C) does not show any 7AAD positivity. Cells were also stained with anti-Gal-3 antibodies. (A) Representative histograms of Gal-3 staining (green lines). Gray histograms: unstained. (B) Representative confocal images of Gal-3 staining. Red: Gal-3; Blue: Dapi. Magnification 63×. Images were optimized for brightness/contrast using imageJ. (C) Representative ImageStream images of Gal-3 staining. Magenta, Gal-3; Blue, Dapi; Green, GFP. (D) Quantification of Gal-3 intracellular distribution by ImageStream technology. Data are reported as relative expression of Gal-3 among the indicated cell lines; the blue bar reports the percentage of nucleo-cytoplasmic distribution of Gal-3, the magenta bar reports the percentage of mainly cytoplasmic distribution of Gal-3. Statistical analysis was performed using Student T-test. The panel is a pool of three independent experiments. (E) Quantification of Annexin V+ cells analyzed by flow cytometry in the reported cell lines. Statistical analysis was performed using Student T-test. The panel reports one experiment representative of three independent experiments. *p < 0.05.

