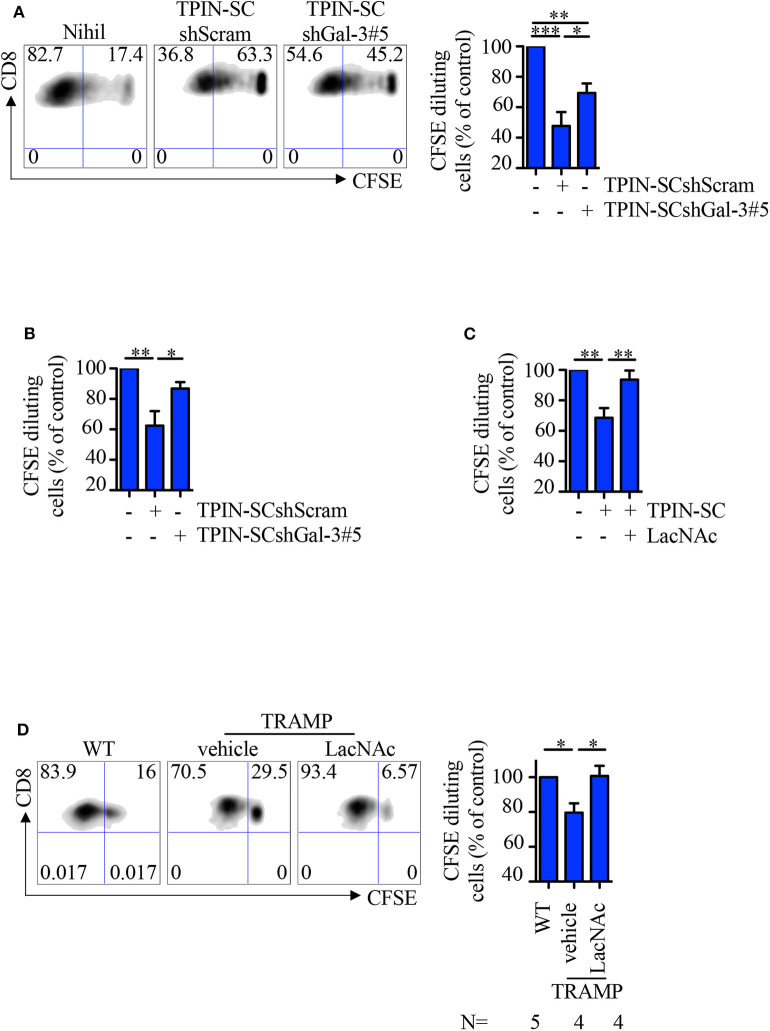
Figure 5.
TPIN-SC use Gal-3 to dampen T cell proliferation. Naïve (A,C) or RAG-OT1 (B) splenocytes were labeled with CFSE, and activated with anti-CD3 and anti-CD28 beads (A,C) or OVA (B), respectively, in the presence or absence of irradiated TPIN-SC cells (C), or TPIN-SC infected with lentiviral vectors encoding Gal-3-specific shRNA [TPIN-SCshGal-3#5 (A,B)] or unspecific [TPIN-SCshScram (A,B)]. Where indicated, 5 mM LacNAc was added to the culture (C). Representative dot plots of CFSE dilution for each experimental condition (A) and quantification of CFSE dilution reported as percentage of CD8 proliferating T cells at day 4 (A,C) or day 3 (B). Values were normalized to the positive control (splenocytes activated with anti-CD3 and anti-CD28 beads or OVA). Statistical analysis was performed using Anova followed by Tukey's test or Student T-test. Graph (A) is a pool of nine independent experiments; graph (B) is a pool of four independent experiments; graph (C) is a pool of six independent experiments. (D) CFSE dilution of CD8 T cells from prostate-draining lymph nodes of 12/13-week-old TRAMP and wild type (WT) mice at day 3 of stimulation with anti-CD3/CD28 beads. Cells from TRAMP-derived prostate-draining lymph nodes were subdivided in two parts, one of which was also incubated with 5 mM LacNAc. Representative dot plots of CFSE dilution for each experimental condition, and quantification of the percentage of CD8 proliferating T cells at day 3. Each panel is representative of at least two independent experiments. Values were normalized to the positive control (WT). Statistical analysis was performed using Anova followed by Tukey's test. The graph is a pool of four independent experiments. *p < 0.05; **p < 0.01; *** p<0.001.

