-
A
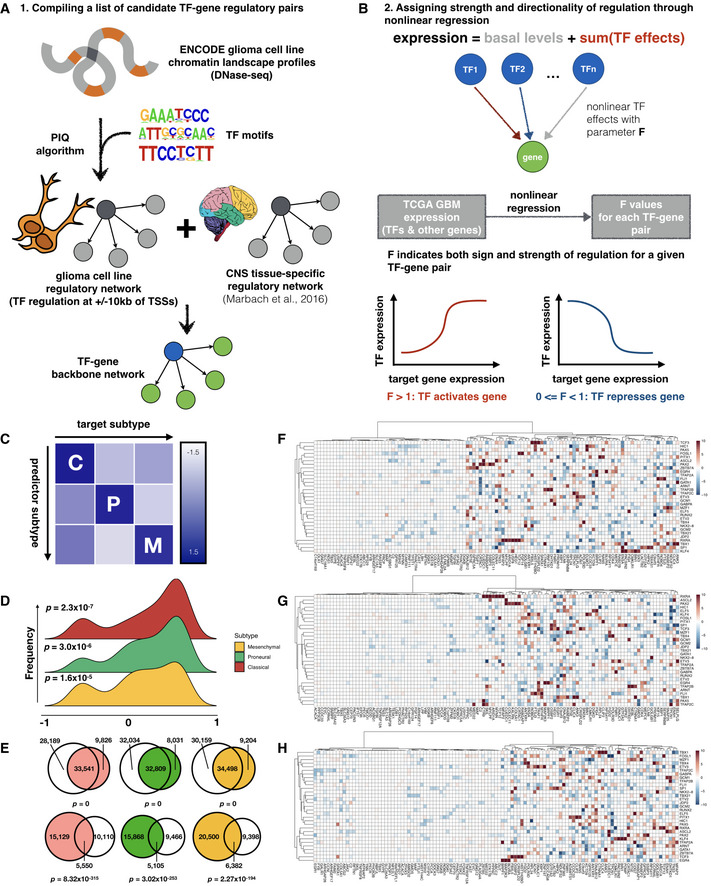
Schematic of workflow for compiling a candidate network for GBM‐specific transcription regulation.
-
B
Nonlinear regression assigns magnitude and directionality of transcription regulation for each transcription factor‐target gene pair through a parameter, F value.
-
C
Inter‐subtype prediction matrix, where the regression model from each subtype along a column is used to predict gene expression in another subtype along a row, and scaled average of the median symmetric mean absolute percentage error (sMAPE) values across top variable genes is visualized as heatmap colors.
-
D
Distribution of correlation coefficients between F value profiles obtained from bulk (TCGA) and single‐cell datasets.
-
E
Venn diagrams showing overlap of edges between regression models built from TCGA and CGGA where a transcription factor shows up‐regulation (upper row) or down‐regulation (lower row) of its target genes. Shown from left to right are Classical (red), Proneural (green), and Mesenchymal (orange) subtypes, respectively, and corresponding CGGA subtypes are colored in gray. Fisher's exact test P‐values for Venn diagrams are labeled correspondingly.
-
F–H
Heatmaps of representative subsets of F values for the 3 GBM subtypes (Classical, Proneural, and Mesenchymal, respectively). Rows and columns correspond to transcription factors and target genes with top absolute log2 F values, respectively.

