-
A
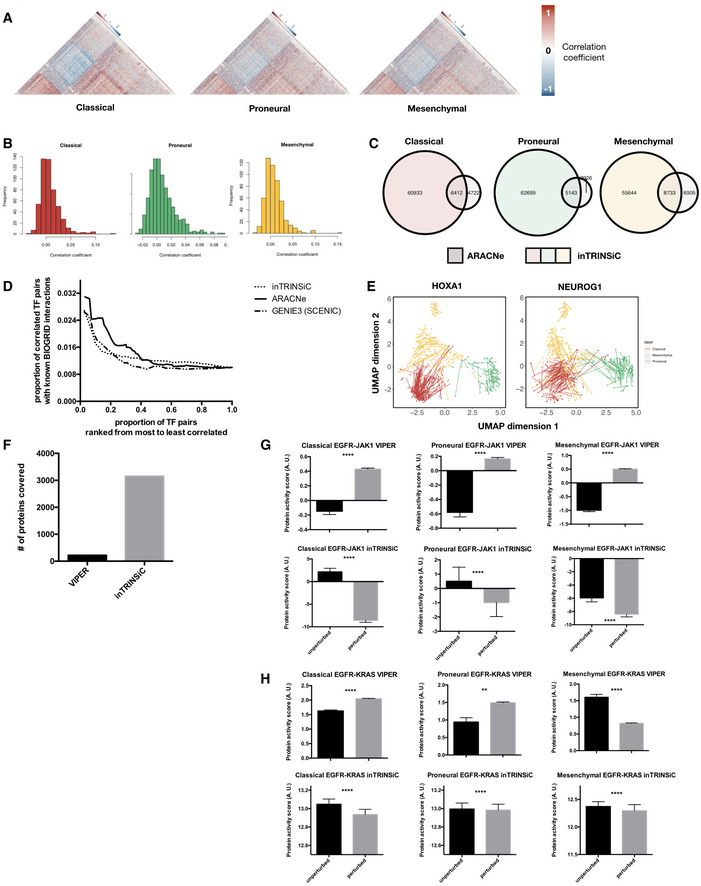
Heatmaps of correlation coefficients among TF regulatory profiles in each GBM subtype. The Classical subtype heatmap was ordered using hierarchical clustering with the average linkage method as the reference and all other heatmaps were ordered in the same way for comparison. Only upper triangular matrices are shown.
-
B
Histograms of Pearson correlation coefficients between transcription regulatory parameters inferred by inTRINSiC (F values) and ARACNe (mutual information). The RANSAC method was used to prevent correlation from being heavily skewed by extreme values.
-
C
Overlap between TF‐TF interactions inferred by inTRINSiC and ARACNe using correlation among pairs of TF regulatory profiles. Fisher's exact test P‐values are 2.55 × 10−58, 2.31 × 10−131, and 4.63 × 10−95 for overlap between Classical, Proneural, and Mesenchymal datasets, respectively.
-
D
Enrichment of known BIOGRID interactions recovered by inTRINSiC (dotted curve), ARACNe (solid curve), and GENIE3 (used in the SCENIC pipeline) plotted against increasingly relaxed threshold on TF‐TF parameter correlation thresholds. P‐value for Fisher's exact test of proportion of known interaction pairs among top 1% correlated TFs compared with selecting all possible interaction pairs: 1.655 × 10⁻¹² for inTRINSiC, 1.19 × 10⁻¹⁷ for ARACNe, and 3.313 × 10⁻¹² for GENIE3.
-
E
UMAP projections of TCGA samples upon simulated knockdown of HOXA1 (left panel) and NEUROG1 (right panel). Each arrow points from the TCGA sample before perturbation to the same sample after perturbation in the same UMAP embedding.
-
F
Number of proteins covered by VIPER and that covered by the exponential ranking protein activity inference function in inTRINSiC.
-
G, H
Inferred response of STAT3 (i) and KRAS (j) protein activity to EGFR inhibition in each of the three subtypes predicted by VIPER (upper panels) or inTRINSiC (lower panels). P‐values are calculated using Wilcoxon matched‐pairs signed rank test. ****P < 0.0001, **P < 0.01. Bars represent mean ± SEM. # of patients in each subtype: Classical—139, Proneural—103, Mesenchymal—165.

