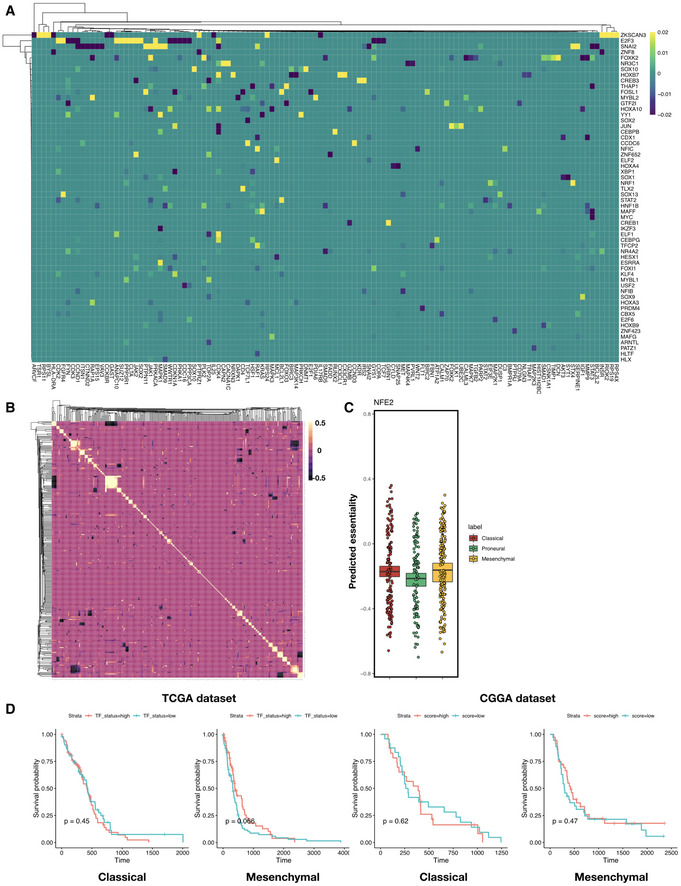
Heatmap of elastic net regression coefficients for predicting susceptibility to the perturbation of each TF. Shown are TFs with top absolute regression coefficients (maximum absolute value > 0.01 across all predictors), and rows and columns are both ordered using hierarchical clustering with the Weighted Pair Group Method with Centroid Averaging (WPGMC) method.
WPGMC‐clustered heatmap of correlation coefficients among the regression coefficient vectors of TFs.
In silico knockdown of NFE2 in TCGA GBM samples potentially confers a Proneural‐specific therapeutic advantage. Shown are jitter plots of predicted essentiality scores of NFE2 in tumor samples grouped by subtype. Box plots show 25th, 50th, and 75th percentiles, and whiskers extend up to 90th and down to 10th percentiles. P‐value for one‐way analysis of means among scores across subtypes is 1.16 × 10⁻¹¹ (df1 = 2, df2 = 252.12). # of patients in each subtype: Classical—139, Proneural—103, Mesenchymal—165.
Kaplan–Meier curves for TCGA and CCGA Classical and Mesenchymal tumor patient survival, with patients segregated into MYBL2‐high (salmon curve) and MYBL2‐low (teal curve) groups. Log‐rank test P‐values are shown for each subtype. Number of patients in TCGA Classical subset: MYBL2‐high—62, MYBL2‐low—63, TCGA Mesenchymal subset: MYBL2‐high—79, MYBL2‐low—80. Number of patients in CGGA Classical subset: MYBL2‐high—24, MYBL2‐low—24, CGGA Mesenchymal subset: MYBL2‐high—37, MYBL2‐low—38.

