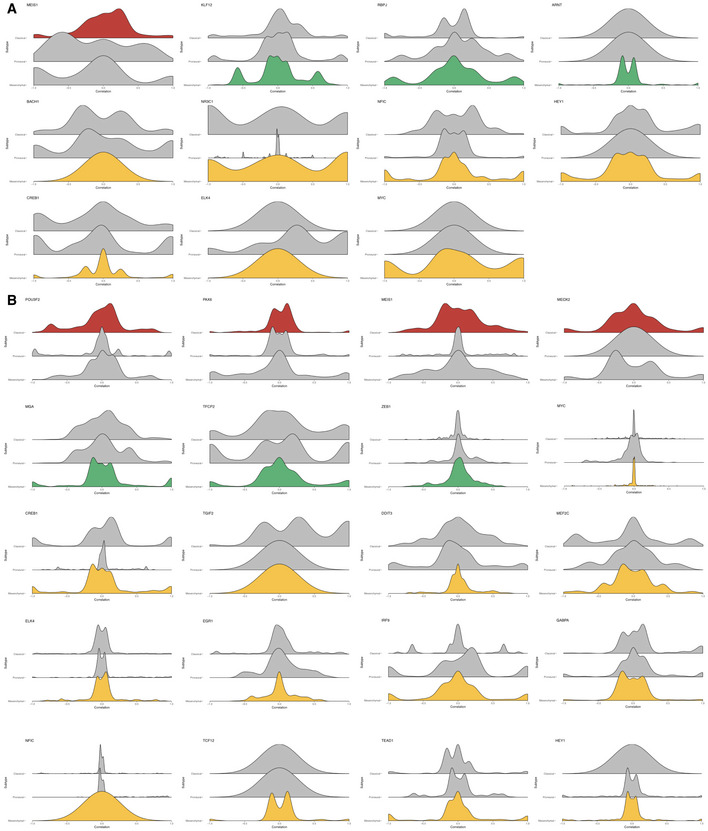
Figure EV6. Additional plots of TF partnering at differentially regulated genes in GBM .

-
A, BHistograms of correlation coefficients of signature TFs with other TFs at differentially regulated target genes where the log2 F values at these target genes in the signature subtype are higher (A) or lower (B) than the average across all subtypes. Plots are grouped according to signature subtype. Histograms in each subplot are arranged in the order of Classical, Proneural, and Mesenchymal subtypes from top to bottom.
