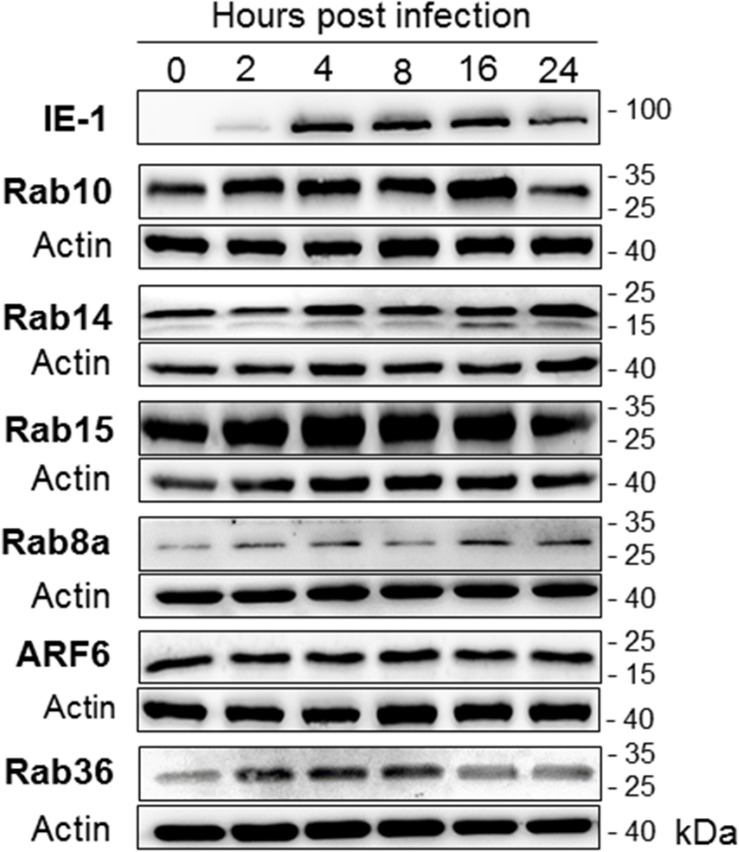
FIGURE 10.
The expression level of host-cell small GTPases that act at the EE-ERC-TGN interface. Western-blot analysis was performed using lysates of uninfected (0 hpi) and MCMV-infected (Δm138-MCMV, MOI 10) Balb 3T3 cells at various stages of infection (2–24 hpi). The kinetic expression of each small GTPase was determined by simultaneous analysis of MCMV IE1 protein (shown is a representative image) and β-actin at the same membrane. Shown are images of representative experiments out of 3–5 experiments. 1-column fitting image.

