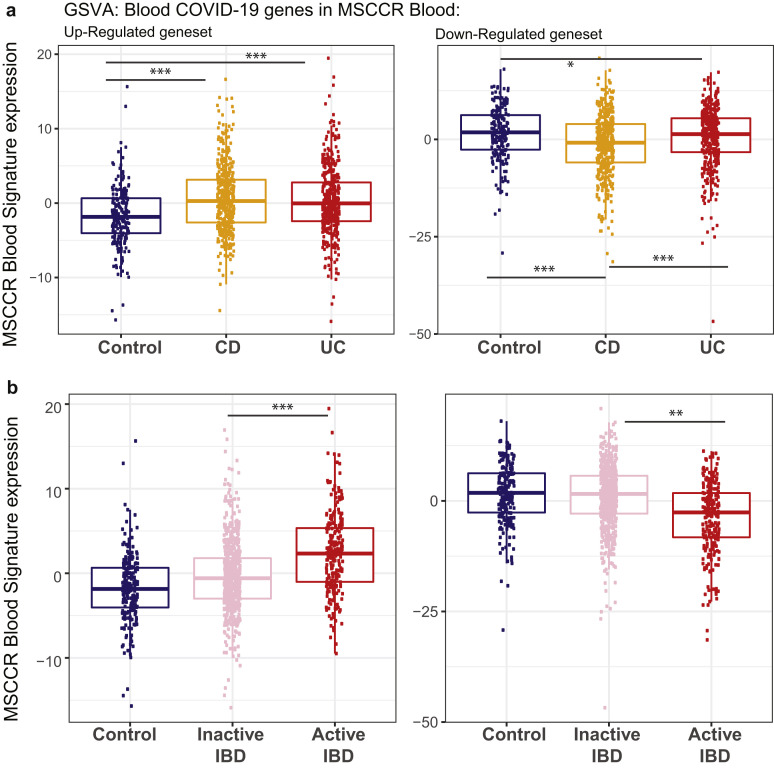
Supplementary Figure 11.
Expression of a blood signature of genes responsive to COVID-19 infection in blood transcriptome of adult patients with IBD and controls (MSCCR cohort). Box plot summarizing the expression of the blood signature identified in COVID-19–infected patients vs healthy controls21 as determined in the blood transcriptome data of (A) the MSCCR CD (n = 432) and UC (n = 389) patients and controls (n = 209) and (B) between clinically defined inactive (n = 288 CD, n = 340 UC) vs active (n = 72 CD, n = 49 UC) MSCCR IBD patients (right). GSVA scores associated with up-regulated genes are shown on the left and down-regulated genes are shown on the right. P values denote significance with ∗P < .05, ∗∗P < .01, and ∗∗∗P < .001.

