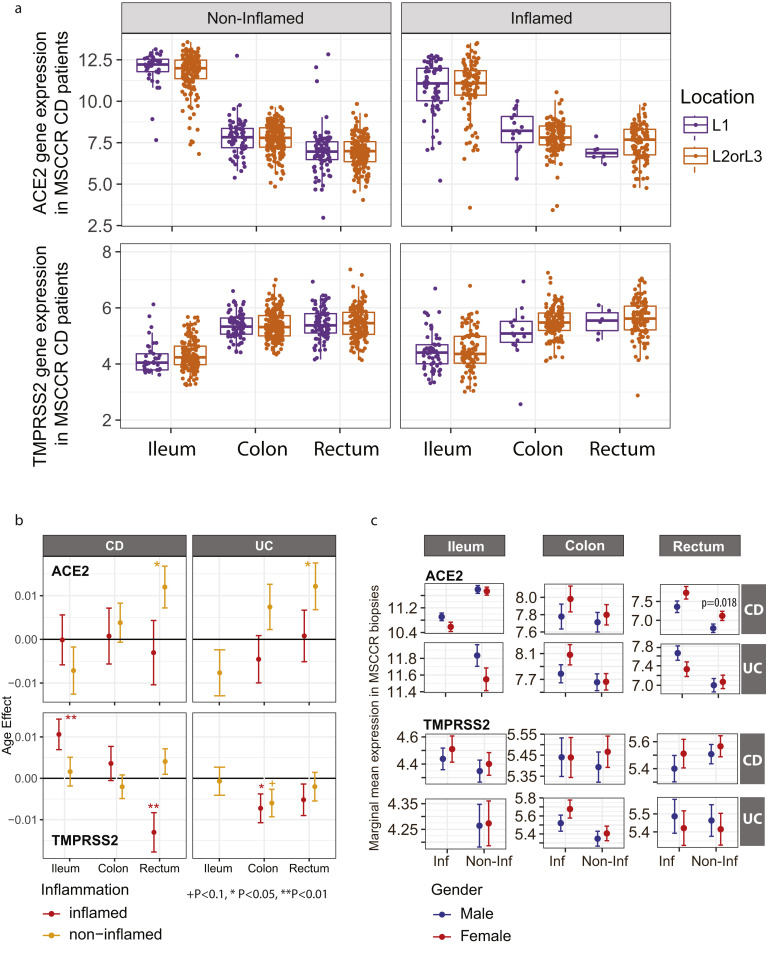
Supplementary Figure 4.
ACE2 and TMPRSS2 gene expression according to location of disease in CD patients and effects of age and gender. (A) Normalized gene expression of ACE2 (top) and TMPRSS2 (bottom) summarized according to patients with CD with L1 (purple) or L2/L3 (orange) disease separated by region. Biopsies from endoscopically defined noninflamed (left) or inflamed (right) areas are examined separately. (B) The effect of gender and age effect on ACE2 TMPRSS2 gene expression was estimated using a multivariable model with smoking, age, gender, and 2 interaction of age and gender and IBD subtype and Tissue. The coefficient for Age effect is presented for CD and UC at different regions (ileum, colon, and rectum). P values denote significance of the age effect for each disease and tissue group, +P < .1, ∗P < .05, ∗∗P < .01. (C) We estimated the marginal mean expression of ACE2 and TMPRSS2 for male and female at each region (ileum, colon, and rectum) and disease (CD and UC) group. P values are presented where significant differences between males and females were found.

