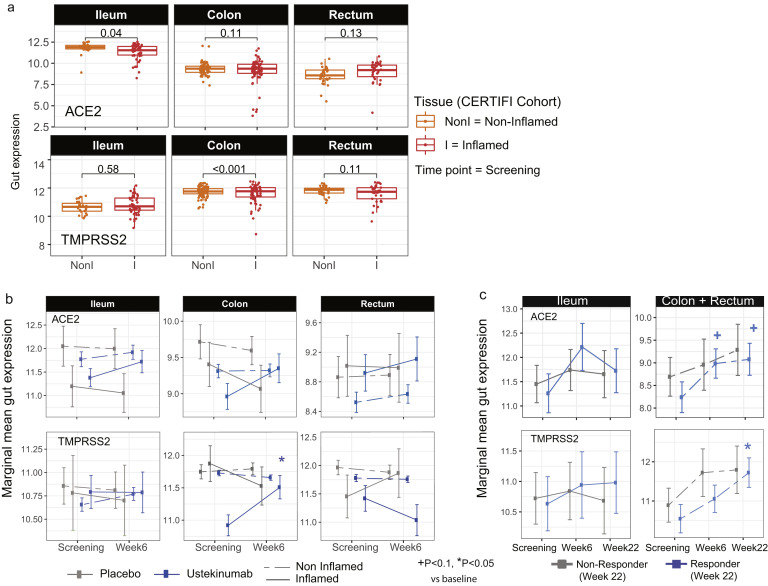
Supplementary Figure 6.
The effect of ustekinumab (CERTIFI cohort) on ACE2 and TMPRSS2 gene expression in the intestine. (A) Baseline differences in expression of ACE2 and TMPRSS2 between inflamed and noninflamed tissue was estimated across different regions (ileum, colon, and rectum) using a mixed-effect model with tissue and region and its interactions as fixed effects and random intercepts for each patient. P values indicated the significance of the inflamed vs noninflamed comparison. (B) Changes in gut expression of ACE2 (top) and TMPRSS2 (bottom) in patients with CD treated with ustekinumab (CERTIFI cohort). Treatment changes in expression of ACE2 and TMPRSS2 were modeled using a mixed-effect model with visit, region, tissue, and treatment and its interactions as fixed effects. Marginal estimated means are presented for patients treated with ustekinumab and placebo group at baseline and week 6 across different gut regions. P values denote significance of change at week 6 from screening, +P < . 1, ∗P < . 05. (C) As no change was observed in noninflamed biopsies, treatment effect on inflamed biopsies was compared between week 22 clinical responders and nonresponders vs baseline. +P < . 1, ∗P < . 05. The samples sizes are summarized in Supplementary Table 6.

