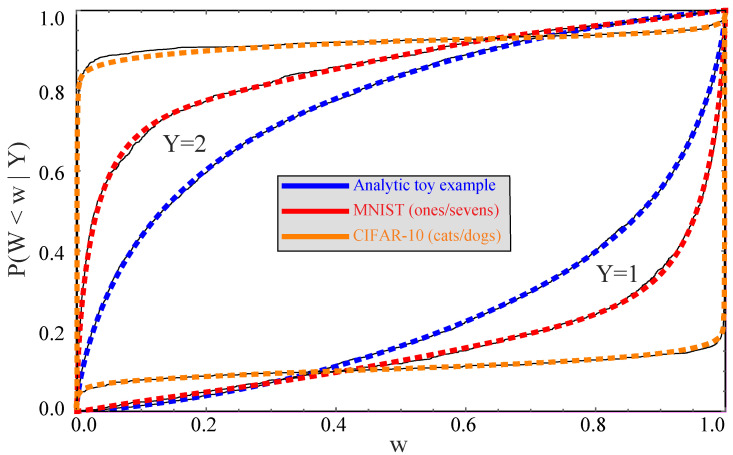
Figure 6.
Cumulative distributions are shown for the analytic (blue/dark grey), Fashion-MNIST (red/grey) and CIFAR-10 (orange/light grey) examples. Solid curves show the observed cumulative histograms of W from the neural network, and dashed curves show the fits defined by Equation (31) and Table 2.

