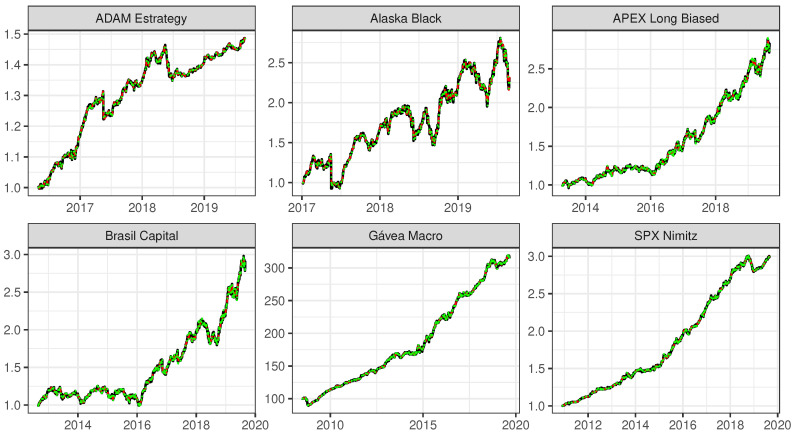
Figure 4.
Original time series (black line); smoothed time series after applying the SSA considering , with the number of eigentriples r as they are defined in Table 2 (red line); and model fit by the ARIMA model (green line), for each of the six mutual investment funds, ADAM Strategy, Alaska Black, APEX Long Biased, Brasil Capital, Gávea Macro and SPX Nimitz, from left to right and from top to bottom. The vertical axes show the quota values.

