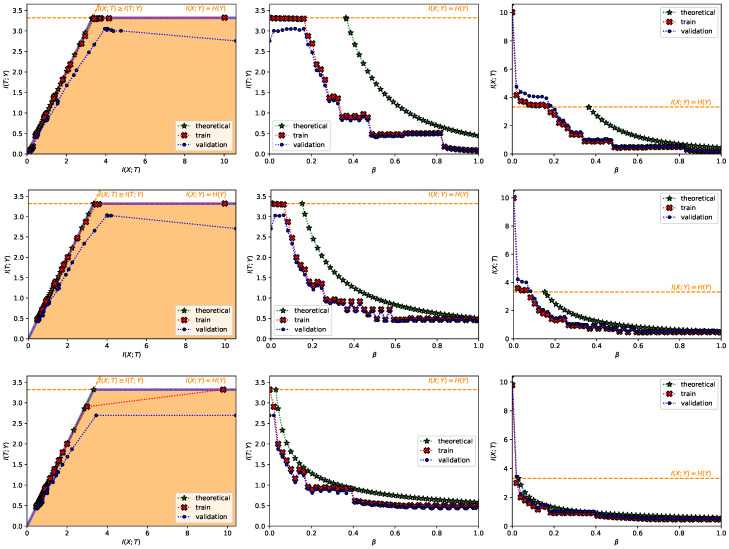
Figure A2.
Results for the power IB Lagrangian in the MNIST dataset with , from top to bottom. In each row, from left to right it is shown (i) the information plane, where the region of possible solutions of the IB problem is shadowed in light orange and the information-theoretic limits are the dashed orange line; (ii) as a function of ; and (iii) the compression as a function of . In all plots, the red crosses joined by a dotted line represent the values computed with the training set, the blue dots the values computed with the validation set and the green stars the theoretical values computed as dictated by Proposition 3. Moreover, in all plots, it is indicated in a dashed, orange line. All values are shown in bits.

