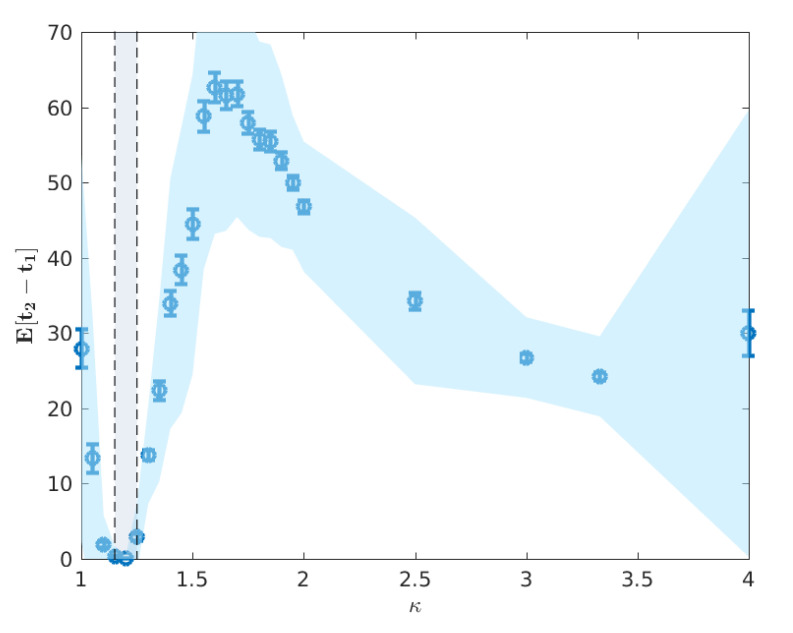
Figure 6.
Mean difference in peak times . Error bars indicate the standard deviation in the difference , whereas the blue shaded region represents the standard deviation of the samples. The vertical shaded region marks the critical interval of for which we observe non-vanishing attack rates (cf. Figure 4). Directly after the critical region, we observe a decoupling in the timing of the epidemic peaks, illustrated by the rapid increase in this difference in the post-critical phase.

