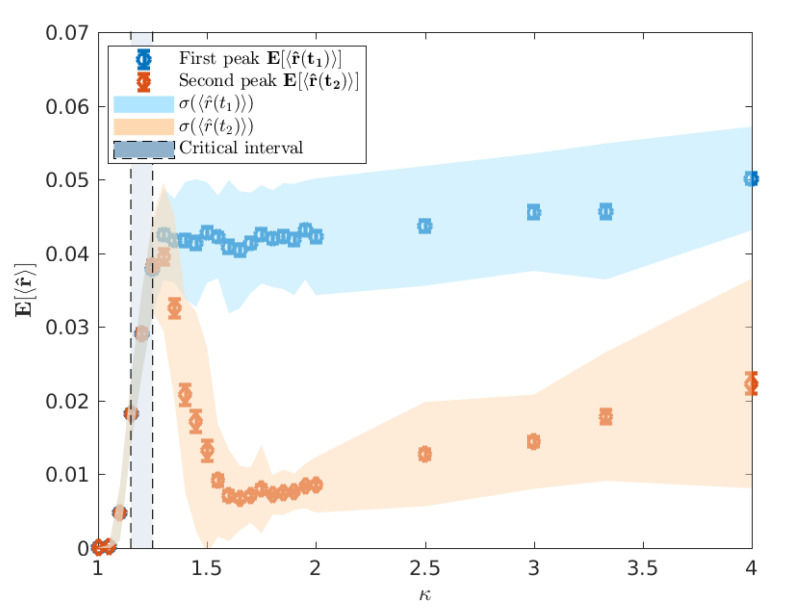
Figure 10.
The average [] over 100 runs, traced across a range of , where is the normalised mean cluster size to which a randomly selected location belongs at each of the two epidemic peaks. The first peak corresponds to the urban wave of the epidemic whereas the second peak reflects the rural epidemic wave. The error bars indicate the standard error of the mean . The vertical shaded area for indicates the critical interval of .

