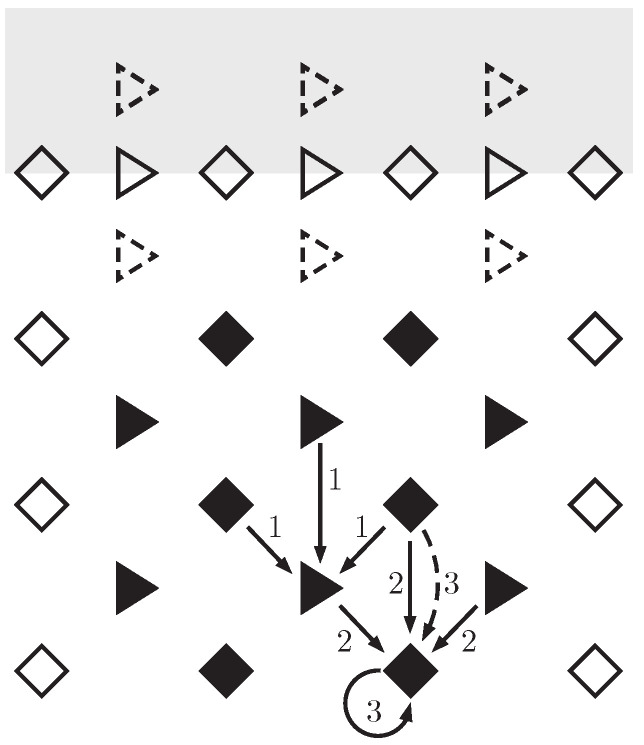
Figure 1.
Visualization of the finite difference numerical scheme. Velocity values stay at triangles, strain and stress values at rhombuses, and filled symbols denote values calculated via the scheme, while empty ones represent initial and boundary conditions. First, new velocities are determined from (23), new strains are obtained according to (25), and new stress values are obtained from (26) or (32). Grey indicates initial condition values (which are typically known for a whole time interval in practice). If the “grey dashed triangles” are not available, then an explicit Euler step can be used to produce the “white dashed triangles” for starting the scheme.

