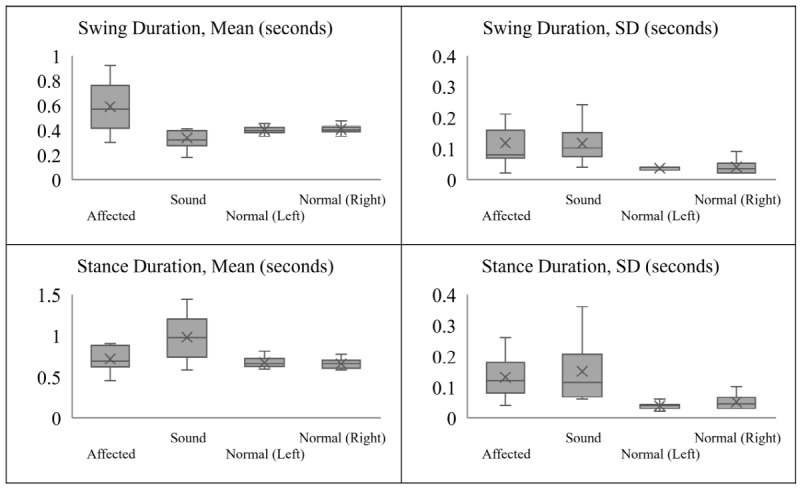
Figure 4.

Boxplot displaying the swing and stance duration distribution of patients’ hemiplegic and sound sides, based on a 5-number summary: minimum, maximum, median, first quartile, and third quartile. X: mean. The patients showed a shorter swing duration on the sound side than the control subjects, whereas that on the hemiplegic side was longer. Patients showed a longer stance duration on both sides compared to the control subjects; however, the sound side showed a markedly longer duration.
