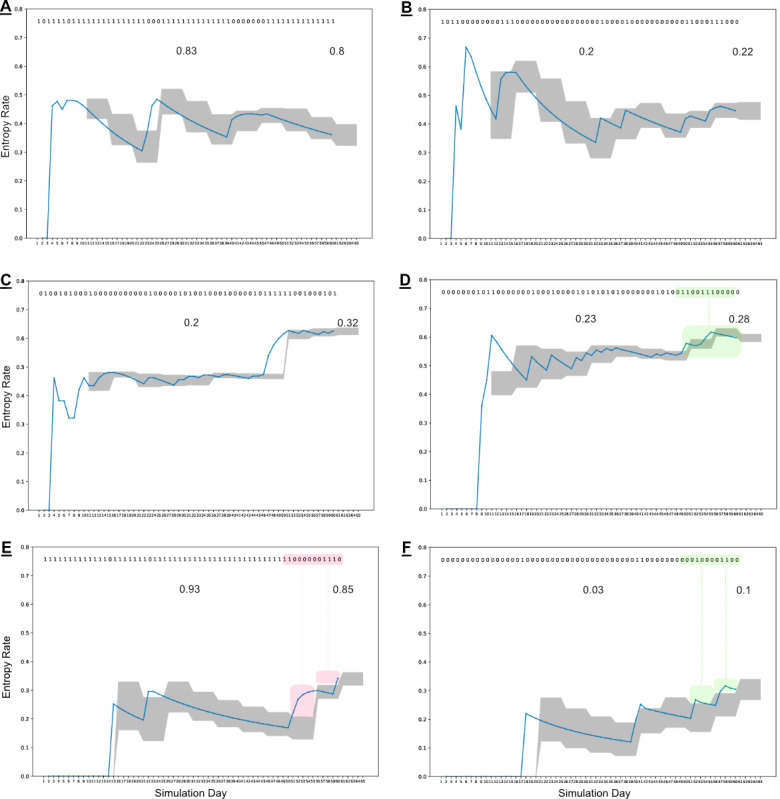
Figure 3.

Adherence volatility plots for 6 simulated—representative—binary Markov chains over 60 days. The binary string at the top represents the underlying simulated data (0=unsuccessful, 1=successful). The 2 numeric values on the insets represent the observed aggregate adherence rates at 30 and 60 days, respectively. The blue line in the figures represents the calculated empirical entropy-rate based on the observed transition probability (TP) matrix to that day, whereas the shaded gray area represents the defined expected boundary across 5-day windows. Anomalies (single windows with deviations) are not highlighted in this figure; however, observed behavioral shifts (at least two consecutive windows with deviations) are identified in the data and trace plots by the green and red boxes. (A) Underlying TPs p01=.3, p10=.1 (expected success rate, ADHexp=0.75). The simulation has high observed adherence rates and 2 identified anomalies from observation windows 1 and 3. (B) Underlying TPs p01=.1, p10=.5 (ADHexp=0.17). The simulation has low aggregate adherence and only one anomaly identified from observation window 2. Both simulations (A) and (B) represent what could be considered as a stable observed ingestion behavior. (C) Underlying TPs p01=.3, p10=.5 (ADHexp=0.38). The simulation again has low observed aggregate ingestion success, but a dramatic anomaly at observation window 8, which seemingly restabilizes. (D) Again has underlying TPs p01=.3, p10=.5. Despite only 5% change in observed ingestion success rate, a behavioral shift is identified across observation windows 8-10 being driven by tighter groups of successes. Both (E) and (F) display behavioral shifts at the end of the simulations, with TPs p01=.5, p10=.1 (ADHexp=0.83) and p01=.1, p10=.3 (ADHexp=0.75) respectively. Groupings of unobserved events are driving the behavioral shift in (E), whereas groupings of successful events are driving the shifts in (F). In the last 2 examples, there is only a 5% to 7% change in observed success rates. These simulations are illustrative but provide insights that anomalies and shifts in this methodology are not required to represent shifts in the underlying system parameters, rather it detects contextual anomalies relative to what has been observed to date.
