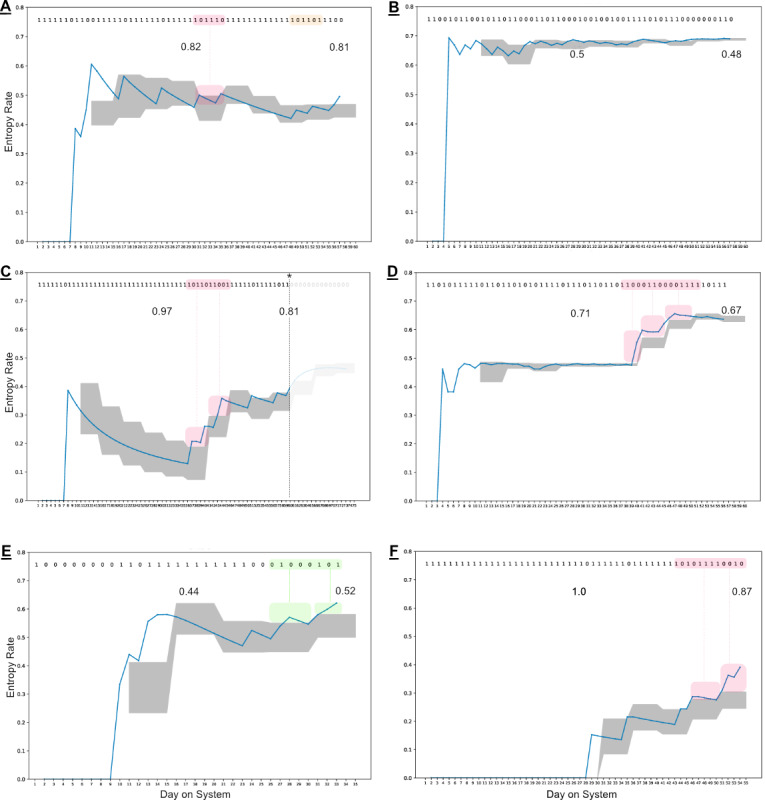
Figure 4.

Clinical data from 6 subjects engaged with the DMS. The binary string at the top represents their observed ingestion data (0=unsuccessful, 1=successful). The 2 numeric values on the insets represent the observed aggregate adherence rates at their individual midway and end-of-treatment points. The blue line in the figures represents the calculated empirical entropy rate based on the observed transition probability matrix to that day, whereas the shaded gray area represents the defined expected boundary across 5-day observation windows. Anomalies (single windows with deviations) are not highlighted here; however, observed behavioral shifts (at least two consecutive windows with deviations) are identified in the data and trace plots by green or red boxes. (A) Demonstrates a behavioral shift driven by increasingly concentrated missed doses relative to historical observations. However, after this behavior is observed, the information is incorporated into future expectation, and when a similar pattern occurs again (light orange box over the observed data), it no longer results in an anomaly. (B) Has a low observed ingestion success rate but appears stable, with only one slight anomaly in window 2. (C) Demonstrates a behavioral shift starting in window 6 being driven by the presence of unobserved doses appearing more tightly clumped together, including consecutive unobserved doses appearing for the first time. Of note for Patient C, only the 60-day treatment window in which patches and medication were available is summarized in this analysis (identified up to the dashed line). (D) Demonstrates a behavioral shift across 3 windows, where sequences of 3 and 4 missed doses begin to surface. (E) Despite early difficulties to day 14, this patient appeared to be experiencing success in week 2 but ends treatment on a behavioral shift. (F) Ends treatment with 87% ingestion success; however, the number and frequency of missed doses in the last 30 days is still changing when the treatment ends. The adherence volatility data for (E) and (F) suggest that there are changes occurring in the patient’s ingestion behavior at the end of treatment that may warrant additional data collection despite their different success rates. Note: These events are generated purely on a statistical basis and would require clinical context and discussion to determine appropriate course of action (if any) when leveraged in real time. DMS: digital medicine system.
