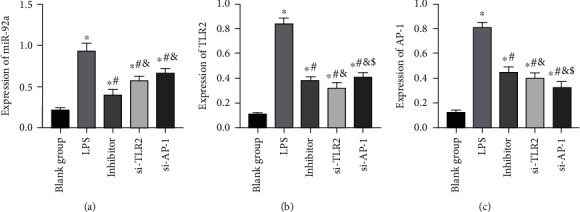
Figure 6.

Results of miR-92a/TLR2/AP-1 transfection in AECs. (a) Changes in miR-92a expression level in AECs. (b) Changes in TLR2 expression level in AECs. (c) Changes in AP-1 expression level in AECs. ∗ indicates P < 0.05 compared with the BG, # indicates P < 0.05 compared with the LPS group, & indicates P < 0.05 compared with the inhibitor group, and $ indicates P < 0.05 compared with the si-TLR2 group.
