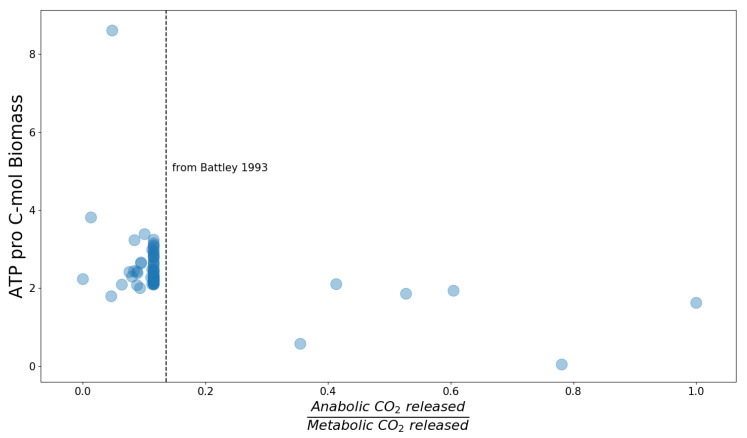
Figure 2.
Anabolic properties of genome-scale models of the BiGG database. The y-axis indicates the minimum required amount of ATP per biomass carbon. The x-axis displays the ratio of carbon dioxide released by anabolism to carbon dioxide released by overall metabolism (including anabolism and catabolism).

