Figure 3.

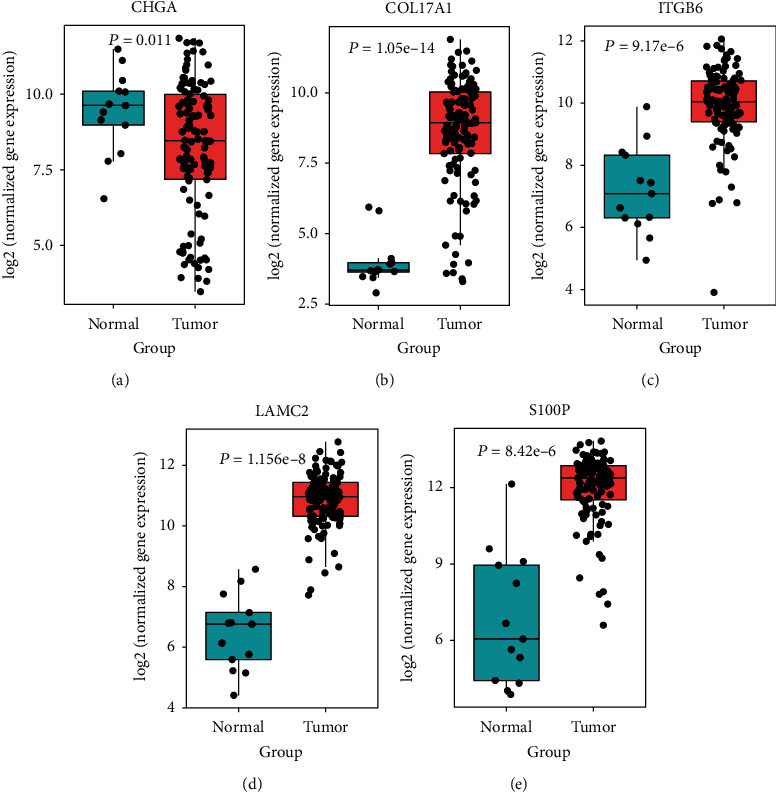
The expression of five genes in PC and normal tissues. (a) CHGA; (b) COL17A1; (c) ITGB6; (d) LAMC2; (e) S100P. P values were calculated by a t-test on the log2 RMA normalization of the expression data.

The expression of five genes in PC and normal tissues. (a) CHGA; (b) COL17A1; (c) ITGB6; (d) LAMC2; (e) S100P. P values were calculated by a t-test on the log2 RMA normalization of the expression data.