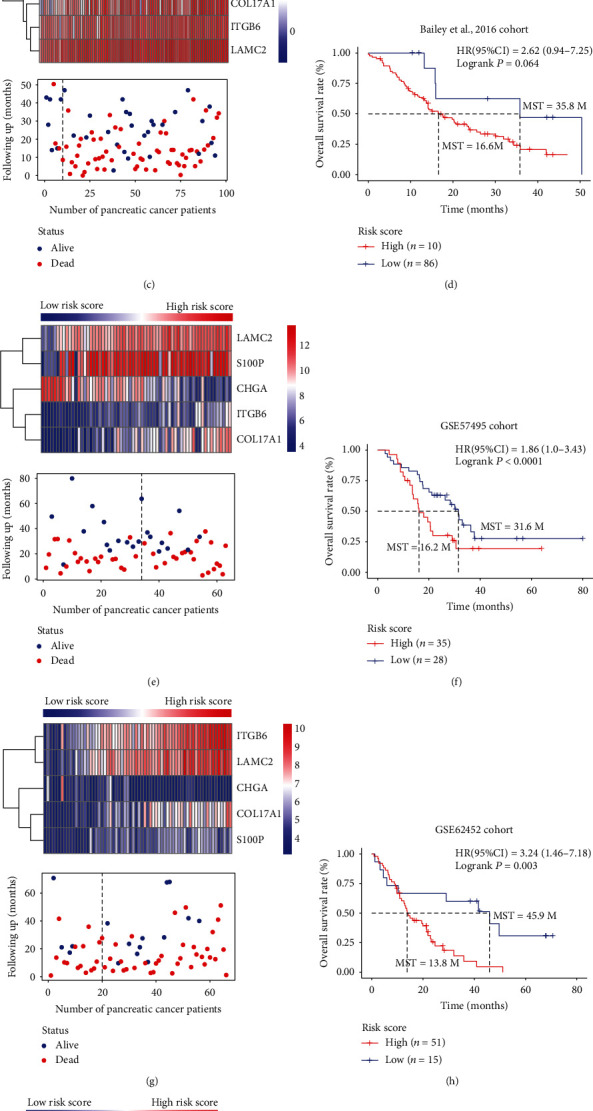
Figure 6.

Performance assessment of the five-gene expression signature model in another five external independent validation datasets. (a, c, e, g, i) The heatmap and distribution of the five-gene expression profiles from low- to high-risk scores for the five external independent validation cohorts. (b, d, f, h, j) Kaplan-Meier overall survival analysis with log-rank test for the PC patients in high- and low-risk groups in five external independent validation cohorts.
