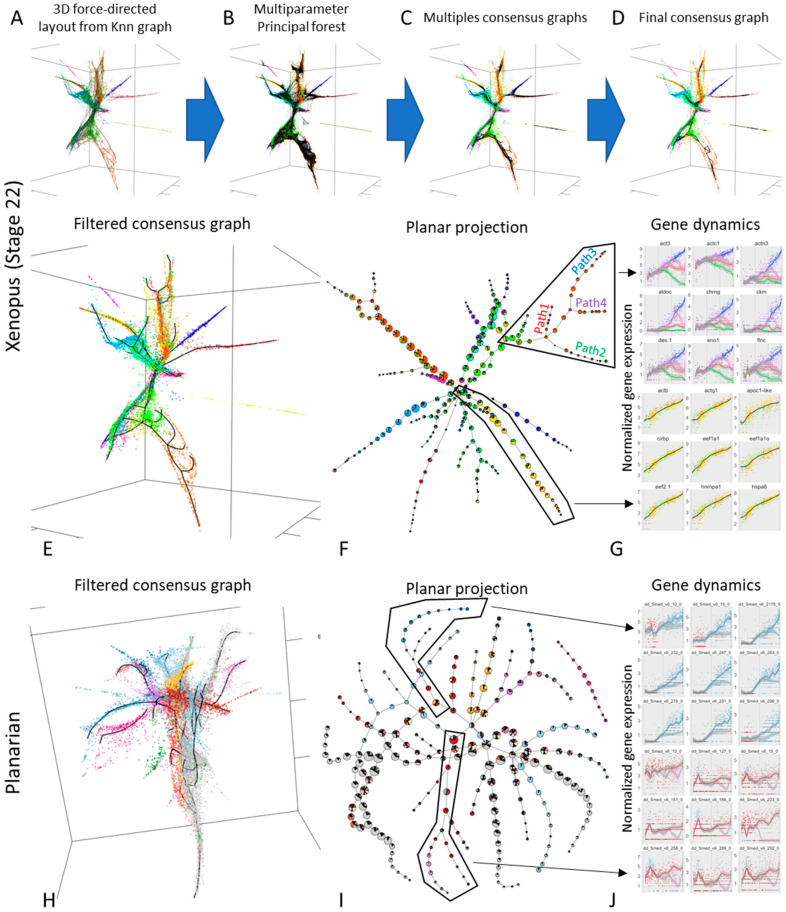
Figure 5.
Using ElPiGraph to approximate complex datasets describing developing embryos (xenopus) or adult organisms (planarian). (A) A kNN graph constructed using the gene expression of 7936 cells of Stage 22 Xenopus embryo has been projected on a 3D space using a force directed layout. The color in this and the related panels indicate the population assigned to the cells by the source publication. (B) The coordinates of the points in panel A have been used to fit 1280 principal trees with different parameters, hence obtaining a principal forest. (C) The principal forest shown in panel B has been used to produce 10 consensus graphs (one for each parameter set). (D) A final consensus graph has been produced using the consensus graphs shown in panel C. (E) A final principal graph has been obtained by applying standard grammar operations to the consensus graph shown in panel D. (F) The associations of the different cell types to the nodes of the consensus graph shown in panel E is reported on a plane with a pie chart for each node. Note the complexity of the graph and the predominance of different cell types in different branches, as indicated the predominance of one or few colors. (G) The dynamics of notable genes had been derived by deriving a pseudotime for a branching structure (top) and a linear structure (bottom) present in the principal graph of panel E (see black polygons). Each point represents the gene expression of a cell and their color indicate either their associated path (top) of the cell type (bottom). The gene expression profiles have been fitted with a LOESS smoother which include a 95% confidence interval. In the top panel the smoother has been colored to highlight the different paths, with the color indicated in the text of panel F. (H–J) The same approach described by panels A–G has been used to study the single-cell transcriptome of planarians. In panel J, the color of the smoother indicates the predominant cell type on the path. Interactive versions of key panels are available at https://sysbio-curie.github.io/elpigraph/.

