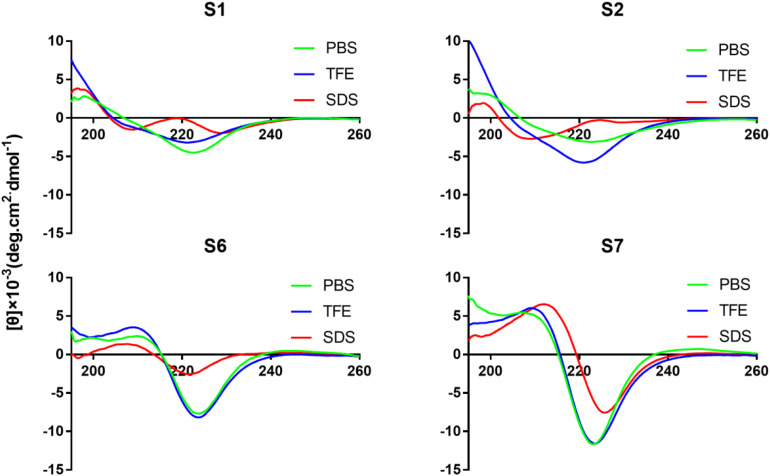
FIGURE 2.
CD spectra of peptides (S1, S2, S6, and S7). All the peptides were dissolved in 10 mM PBS (pH 7.4), 50% TFE, or 30 mM SDS. The mean residual ellipticity was plotted against wavelength. The values from three scans were averaged per sample, and the peptide concentrations were fixed at 150 μM.

