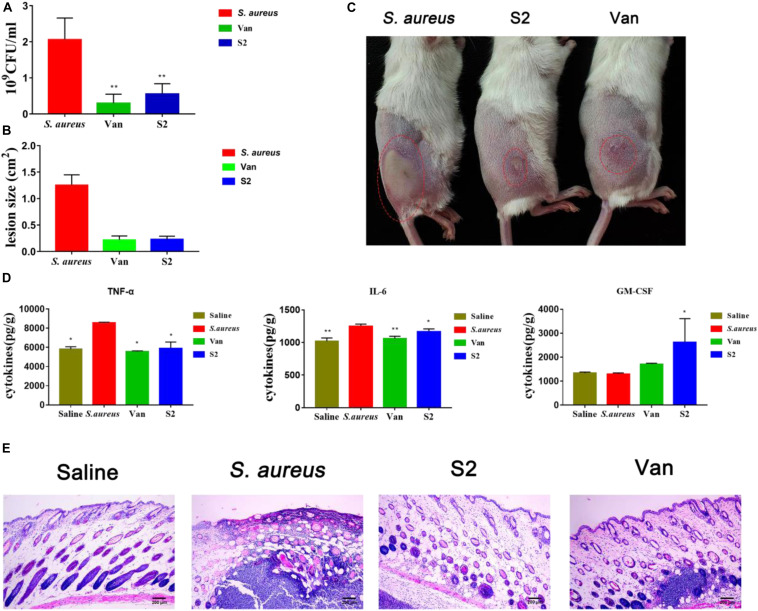
FIGURE 5.
(A) Viable bacteria count at the infection site on day 2 post-infection. **P < 0.01; and *P < 0.05. n = 8. Data represents the mean ± SEM. Means with different letters represent significantly different at P < 0.05 by Duncan’s test. (B) lesions size. (C) Picture was taken at that time, the red circles indicate the infectious sites. From left to right, S. aureus, S2, vancomycin. (D) Effects of S2 and Van on cyst cytokines. **P < 0.01; and *P < 0.05. Data represents the mean ± SEM. Means with different letters represent significantly different at P < 0.05 by Duncan’s test. (E) HE photomicrograph of the skin tissue.

