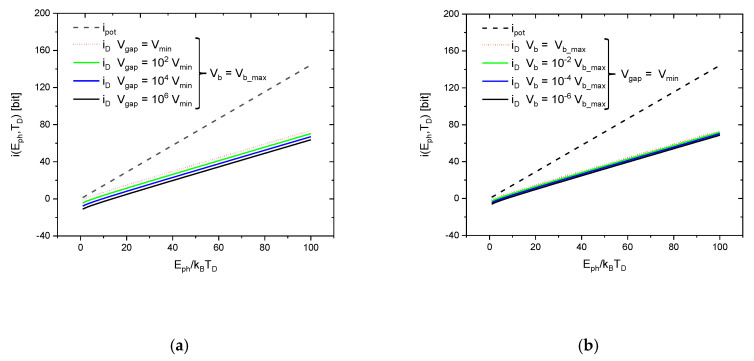
Figure 5.
Information gained in detection, , at different detector operation conditions, compared to the potential information carried by a photon of energy relative to a heat bath with a temperature equal to the detector operation temperature . The differently colored curves stand for different detector operation conditions. In (a) the effect of gap volume variations is shown while the detector is biased at its maximum possible bias voltage; (b) shows the effect of bias potential variations while the detector is operated at its minimum possible gap volume.

