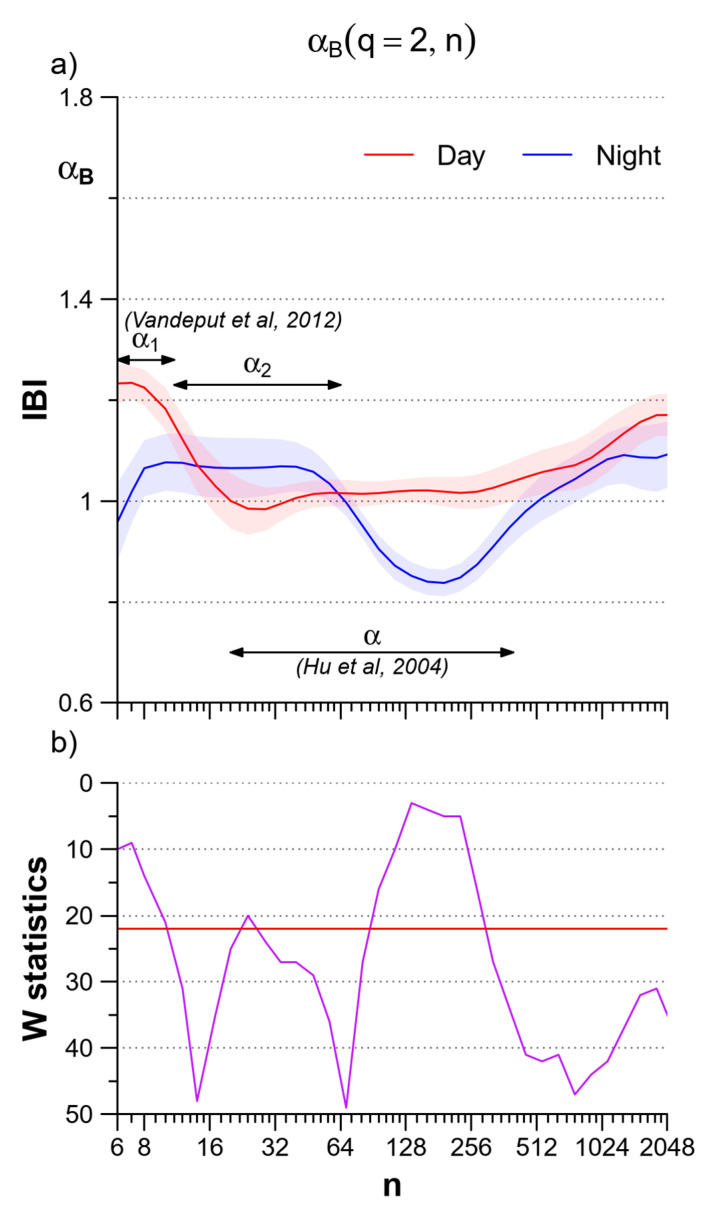
Figure 8.
Day–night comparison of the multiscale monofractal DFA coefficients of IBI plotted vs. the block size n in beats. (a) αB(q,n) calculated for q = 2 (second-order moment of the monofractal DFA) during daytime (red) and nighttime (blue): mean +/− sem over the group of N = 14 participants; the arrows indicate the scale ranges for estimating α1 and α2 as defined by Vanderput et al. in [31] and for estimating α as defined by Hu et al. in [30]. (b) W statistics for the day-night difference in αB(2,n); when W is above the red horizontal line, the difference at the corresponding scale is significant at p < 5%.

