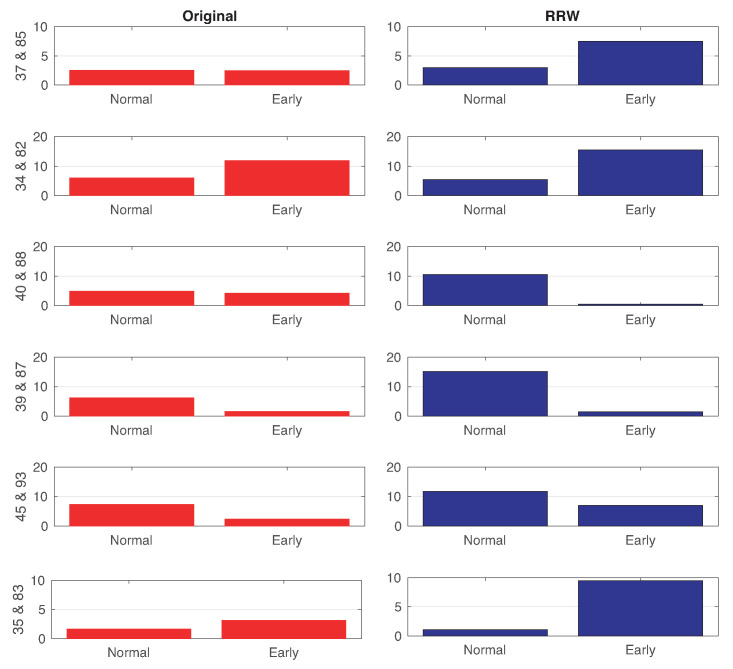
Figure 6.
Differences between the averages of Normal and EMCI subjects in the original directed graph after net4Lap (in red) versus directed Return Random Walk graph (in blue). Rows are the area of brain represented by the difference between the two different ROIs. The bars represent the difference between two regions of the same anatomical region of the brain, and left text labels are these number of regions (see Table 2) implied in each case.

