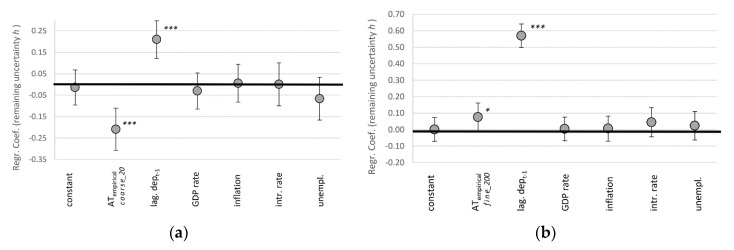
Figure 5.
Regression coefficients for bi-monthly changes in remaining uncertainty in form of entropy rate heM, where algorithmic trading is measured in 20 coarse-grained bins (a) and 200 fine-grained bins (b), indicating 95% confidence intervals with error bars. *** p < 0.01, ** p < 0.05, * p < 0.1 (N = 520).

