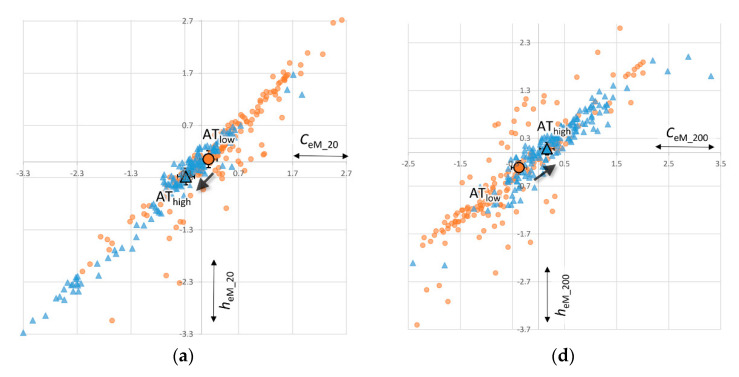
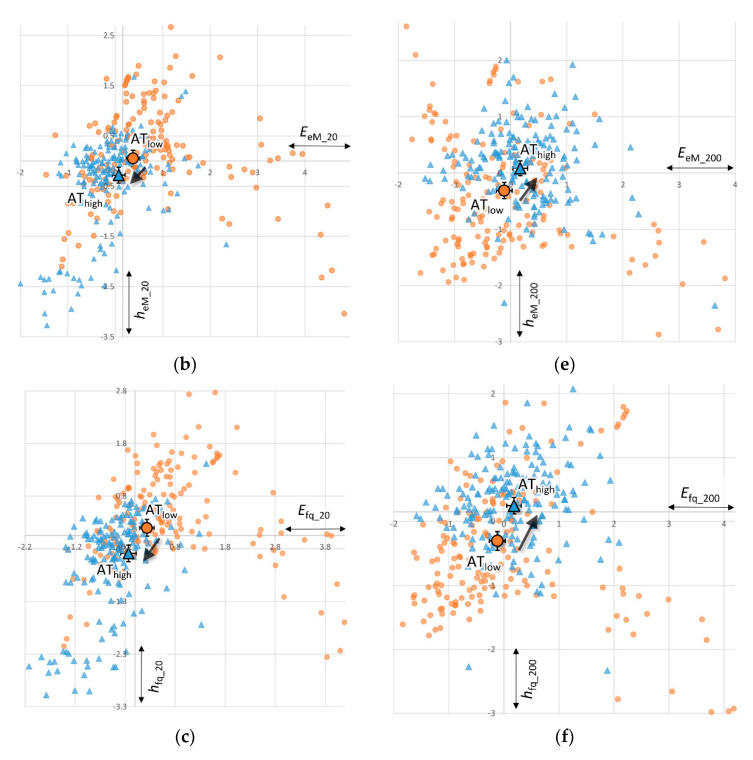
Figure 6.
Estimated marginal means (large dots) from ANVOCA (95% confidence error bars), with thirds of ATemp as fixed factor, controlling for the covariates dept−1, GDPr, infl, intr, unpl; orange circles: third with lowest algorithmic trading (ATlow); blue triangles: third with highest algorithmic trading (AThigh); (a–c) for coarse-grained perspective of 20 bins, (d–f) for fine-grained perspective of 200 bins. Note: in contrary to means, scatter data points are not corrected for control variables and some outlier are cut off by presentation.


