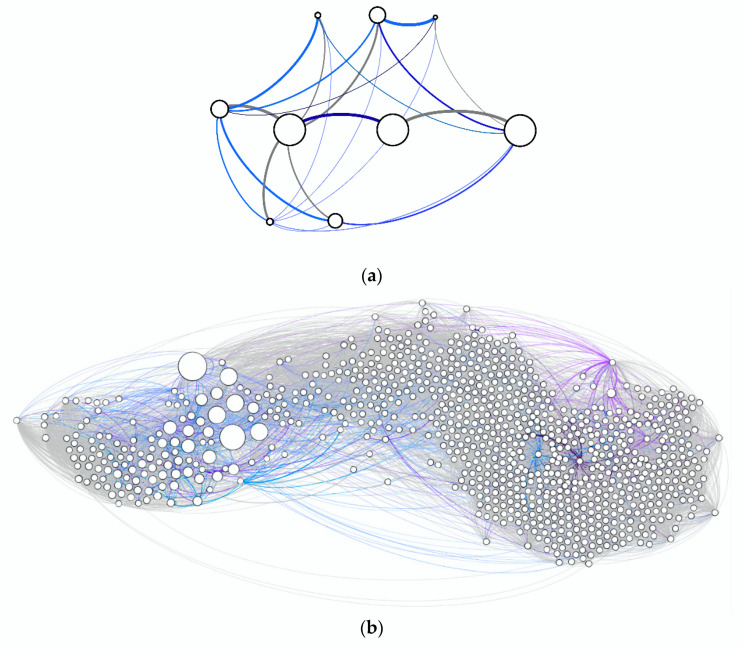
Figure 9.
Visualization of ϵ-machines (aka predictive state machines) derived for (a) AUD/JPY Mar.–Apr. 2009, 200 bins; (b) EUR/AUD Jan.–Feb. 2017, 200 bins. The size of a node represents the steady state probability of the corresponding state. Clockwise curve indicates transition directionality. Transition color corresponds to symbols in the alphabet in the sequence.

