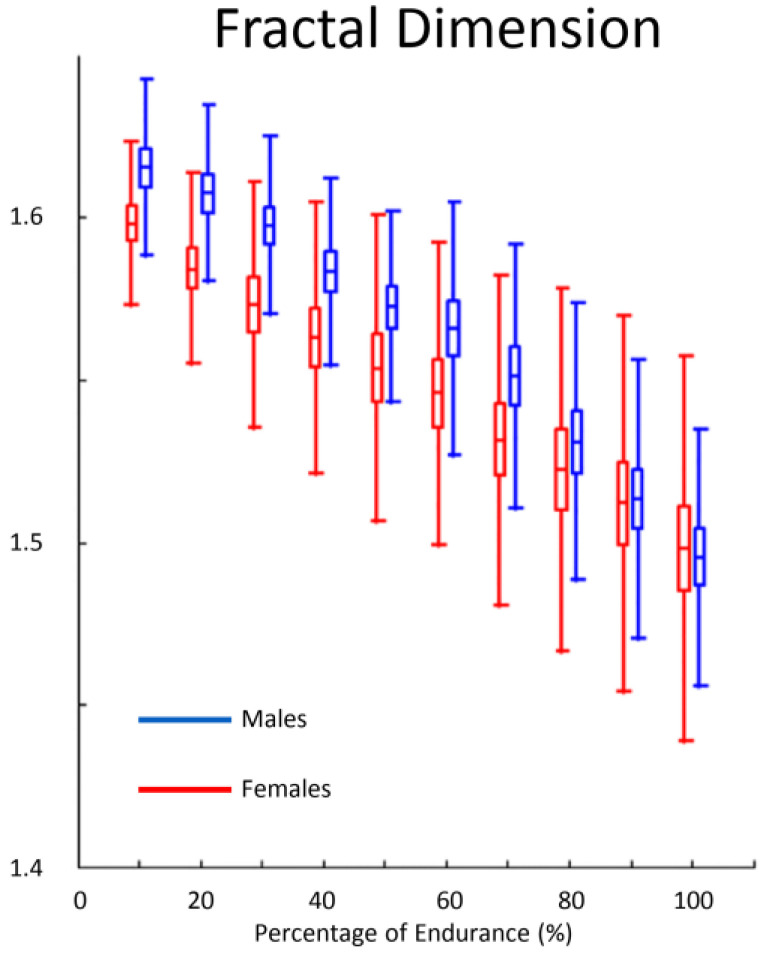
Figure 3.
Mean percentage of changes in FD versus time in males (blue) and females (red) during 60% MVC prolonged contraction. The time scale is expressed as a percentage of the total exhaustion time for each subject (from Meduri et al., [85] with permission).

