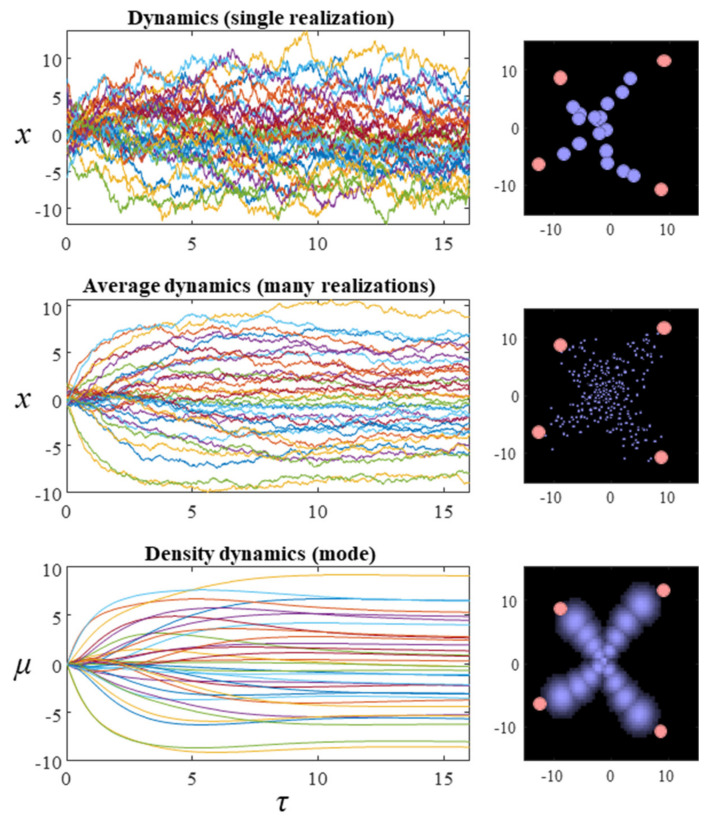
Figure 2.
The plots in this figure illustrate the evolution of the random dynamical system whose Hamiltonian is shown in Figure 1. The plots on the left show the evolution of the system over time. This is a 34-dimensional system, which is shown on the right in terms of 17 particles, whose positions are described by two coordinates. The plots on the right show the final configuration at the end of the simulation. The first row shows a single realization of a stochastic trajectory. The second averages over 16 realizations of the trajectory. The third row shows the density dynamics under a Laplace approximation. The mean-field factorisation treats each particle independently (so each factor is a bivariate normal distribution). The filled pink circles in the plots on the right illustrate the values of the y variables (which are fixed). For ease of visibility, the intensity of each of the densities superimposed on this image have been normalised, such that their mode is the same intensity (regardless of the probability density at that mode).

