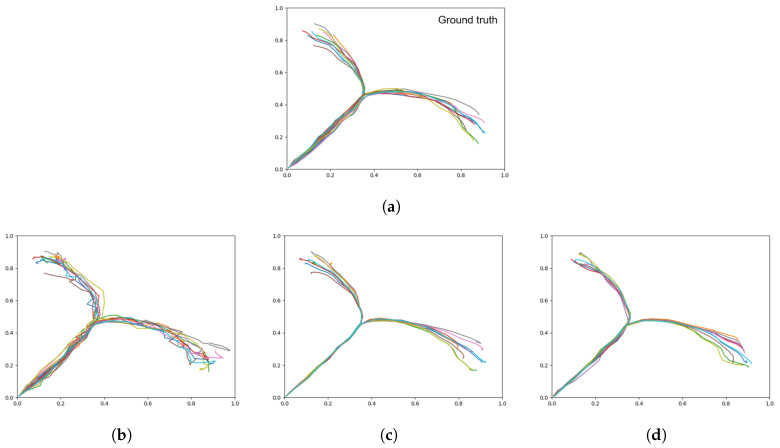
Figure 12.
Plots showing motor plans of the 20 test sequences. (a) Shows the ground truth for untrained test data set, with the remaining plots generated with a (b) weak meta-prior, (c) intermediate meta-prior, and (d) strong meta-prior as described in Table 2.

