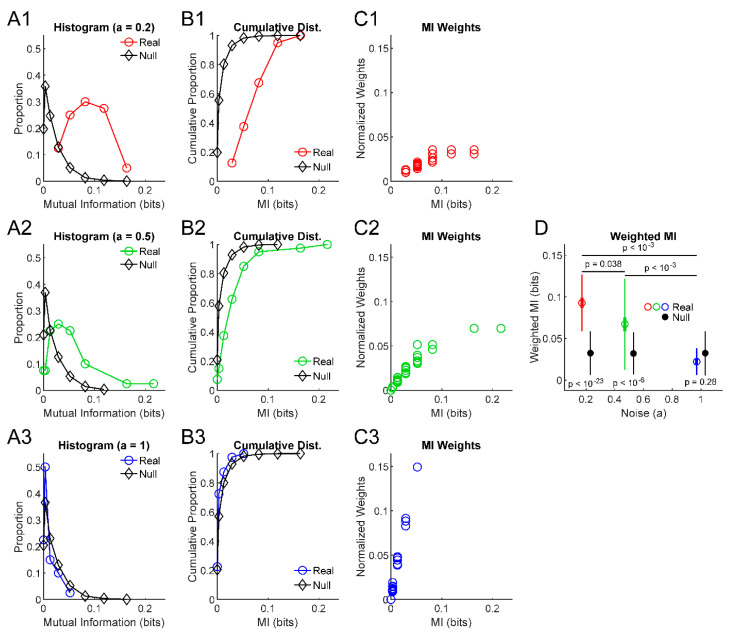
Figure 1.
Assessing ensemble difference from null and differences between ensembles. (A) Histograms of mutual information results from example ensembles of information sources and the null information results from these sources produced through randomization (, , , ). (B) Cumulative distributions of the information values from (A). (C) Scatter plots of normalized weight values (-log10(p)) for each information result. (D) Weighted mean (dot), weighted standard deviation (thin lines), and standard error of the weighted mean (thick lines) for the example ensembles, along with the same results for the null data produced by randomization. Note that the lower noise examples (1 and 2) produced very low p-values in comparison to null data via KS tests (p-values shown below error bars, see (B) for reference). Still, note that null data produced non-zero weighted mean mutual information values. Comparisons between the weighted means of the example ensembles via randomization produced low p-values between all pairs (p-values shown above error bars), though resolution was limited by the number of Monte Carlo trials (1000) to .

