
Figure 5.
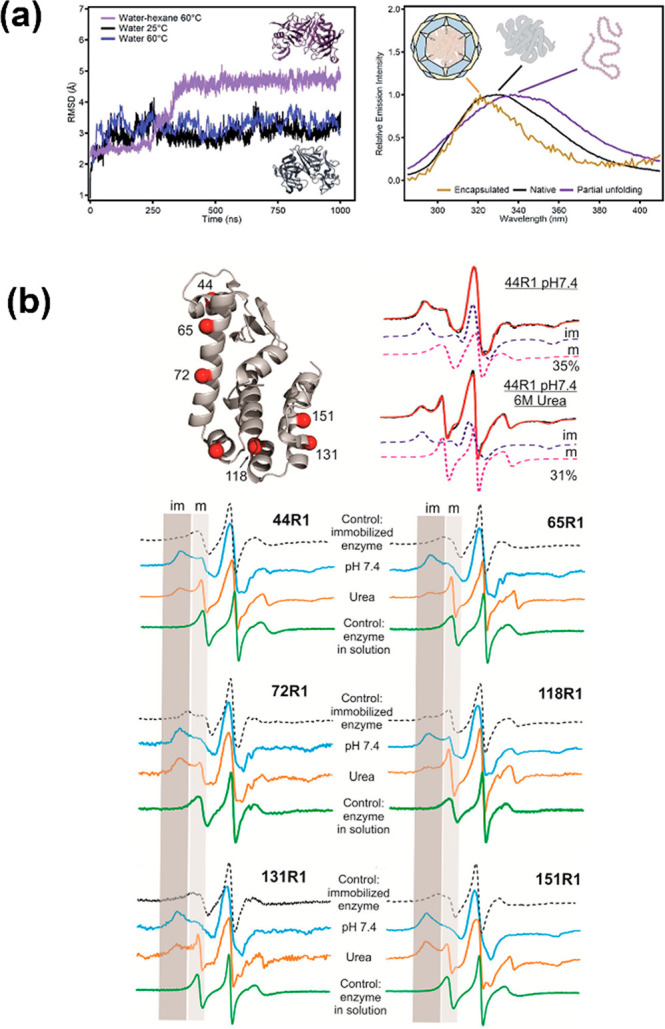
Representation of (a) the RMSD from MD simulations in different media (left) and fluorescence spectra of free protease (black), or in the nonpolar medium (purple) and protease@MIL-101(Al)-NH2 (yellow).50 (b) Surface sites of T4L spin labeled with R1, example spectral simulations of the mobile and immobile components of a labeled site (top), and CW EPR spectra of six labeled sites under various conditions (bottom).51