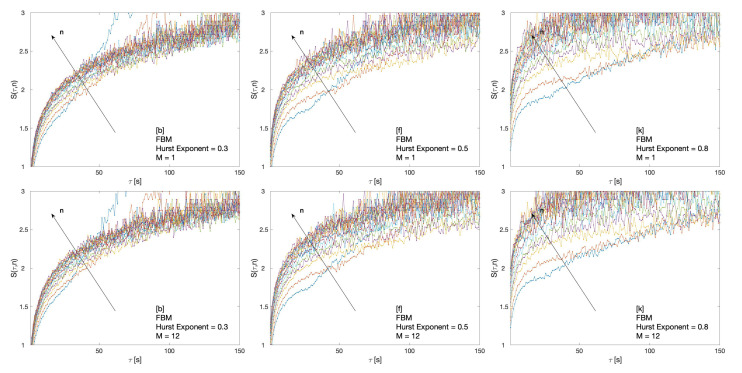
Figure 2.
Cluster entropy results for Fractional Brownian Motion (FBM) series with , , . First row shows results for time horizon (approximately equivalent to the first month (January 2018) of raw data for NASDAQ, S&P500, DIJA). The second row shows results for time horizon (approximately equivalent to twelve months of data in NASDAQ, S&P500, DIJA, i.e, the whole 2018 year).

