
Table 11.
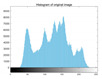
Histogram of the original image and encrypted image.
| Image Name | Histogram of the Original Image | Histogram of the Encrypted Image | χ2 | p-Values |
|---|---|---|---|---|
| Lena |
|

|
278.7992 | 0.7896 |
| 5.2.08 |

|

|
252.6531 | 0.5832 |
| 5.2.09 |

|

|
259.7123 | 0.6816 |
| 5.2.10 |

|

|
264.5217 | 0.7124 |
| 7.1.02 |

|

|
269.1632 | 0.6195 |
| 7.1.03 |

|

|
251.6328 | 0.5913 |
| 7.1.05 |

|

|
272.6374 | 0.7351 |
| 7.1.08 |

|

|
262.6891 | 0.6237 |
| 7.1.10 |

|

|
275.8627 | 0.5769 |
| boat |

|

|
254.1951 | 0.6365 |